29
/pt/
pt
AIzaSyAYiBZKx7MnpbEhh9jyipgxe19OcubqV5w
April 1, 2024
109178
Comoros
COM
true
2
1
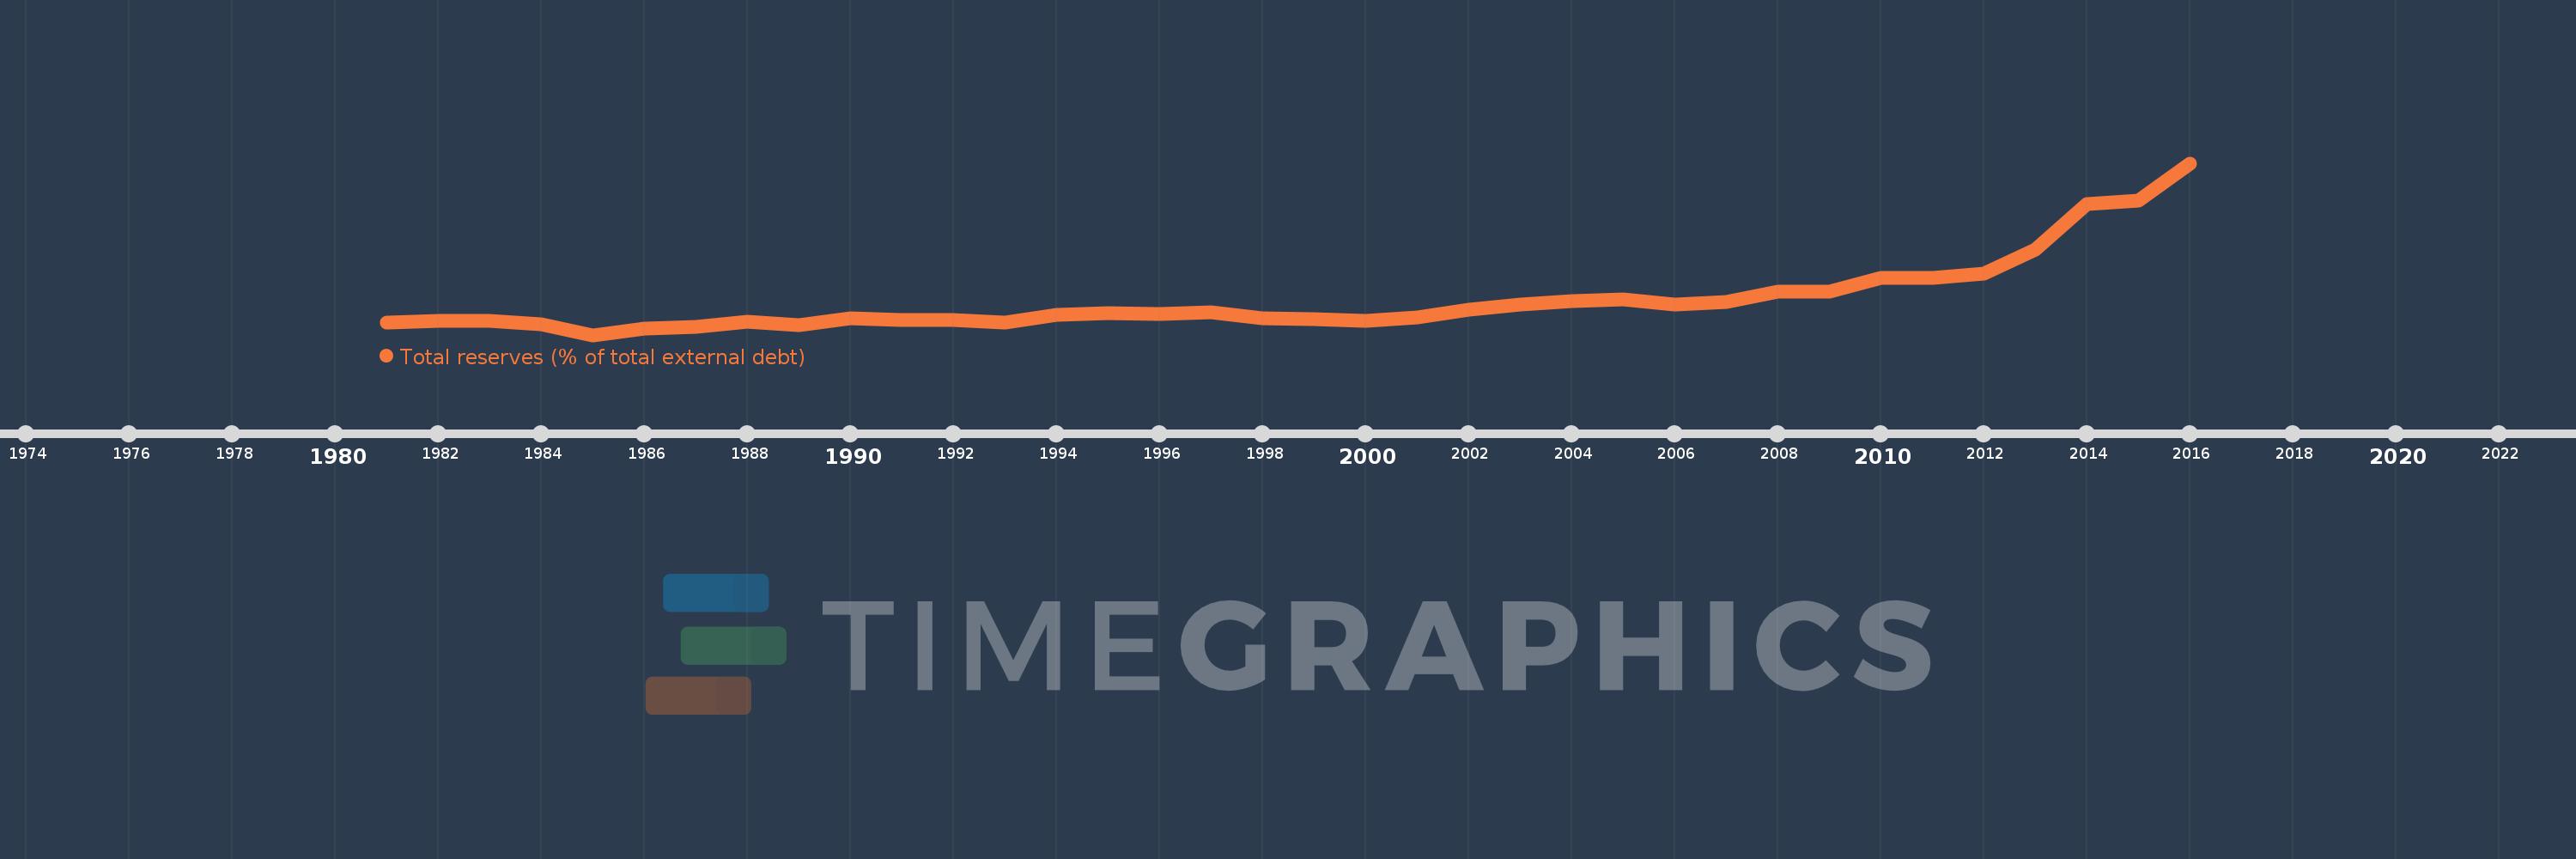
Total reserves (% of total external debt)
2016,2015,2014,2013,2012,2011,2010,2009,2008,2007,2006,2005,2004,2003,2002,2001,2000,1999,1998,1997,1996,1995,1994,1993,1992,1991,1990,1989,1988,1987,1986,1985,1984,1983,1982,1981
Estas estatísticas em outros países:
Linha do tempo:
Nesta escala de tempo está apresentado um gráfico de 1981 ano até 2016 ano Comoros. Dados de 1980 ano ausente. O número de observações reais por data: 36.
Fonte (nome):
Indicadores de desenvolvimento mundial
Fonte (organização):
World Bank, International Debt Statistics.
Categorias:
Financial Sector, External Debt
Foi atualizado:
23 abr 2017 ano
Indicadores de alterações dos valores ao longo dos anos
Mínimo:
3.517
1 jan 1985 ano
Máximo:
150.294
1 jan 2016 ano
Na data de observação
Valor
Mudança absoluta
A alteração em relação ao valor anterior
1 jan 1981 ano
14.491
+14.491
0.0%
1 jan 1982 ano
15.298
+0.808
5.57%
1 jan 1983 ano
15.711
+0.412
2.69%
1 jan 1984 ano
12.838
-2.873
-18.29%
1 jan 1985 ano
3.517
-9.321
-72.61%
1 jan 1986 ano
8.892
+5.375
152.84%
1 jan 1987 ano
10.668
+1.776
19.98%
1 jan 1988 ano
15.22
+4.552
42.67%
1 jan 1989 ano
11.898
-3.322
-21.83%
1 jan 1990 ano
17.748
+5.85
49.16%
1 jan 1991 ano
16.185
-1.563
-8.81%
1 jan 1992 ano
16.368
+0.184
1.13%
1 jan 1993 ano
14.519
-1.849
-11.3%
1 jan 1994 ano
20.818
+6.299
43.38%
1 jan 1995 ano
22.247
+1.429
6.86%
1 jan 1996 ano
21.222
-1.025
-4.61%
1 jan 1997 ano
22.799
+1.577
7.43%
1 jan 1998 ano
18.105
-4.694
-20.59%
1 jan 1999 ano
16.927
-1.178
-6.51%
1 jan 2000 ano
15.956
-0.971
-5.73%
1 jan 2001 ano
18.495
+2.539
15.91%
1 jan 2002 ano
25.512
+7.017
37.94%
1 jan 2003 ano
29.368
+3.856
15.11%
1 jan 2004 ano
32.429
+3.061
10.42%
1 jan 2005 ano
33.997
+1.568
4.84%
1 jan 2006 ano
29.683
-4.315
-12.69%
1 jan 2007 ano
31.835
+2.153
7.25%
1 jan 2008 ano
40.672
+8.837
27.76%
1 jan 2009 ano
40.56
-0.112
-0.27%
1 jan 2010 ano
52.329
+11.769
29.02%
1 jan 2011 ano
52.063
-0.267
-0.51%
1 jan 2012 ano
56.15
+4.088
7.85%
1 jan 2013 ano
76.276
+20.126
35.84%
1 jan 2014 ano
115.236
+38.96
51.08%
1 jan 2015 ano
118.006
+2.77
2.4%
1 jan 2016 ano
150.294
+32.288
27.36%
Classificação de países por estatísticas atuais por anos


Comentários: