29
/pt/
pt
AIzaSyAYiBZKx7MnpbEhh9jyipgxe19OcubqV5w
April 1, 2024
189717
Maldives
MDV
true
2
1
Total reserves (% of total external debt)
2016,2015,2014,2013,2012,2011,2010,2009,2008,2007,2006,2005,2004,2003,2002,2001,2000,1999,1998,1997,1996,1995,1994,1993,1992,1991,1990,1989,1988,1987,1986,1985,1984,1983,1982,1981,1980,1979
Estas estatísticas em outros países:
Linha do tempo:
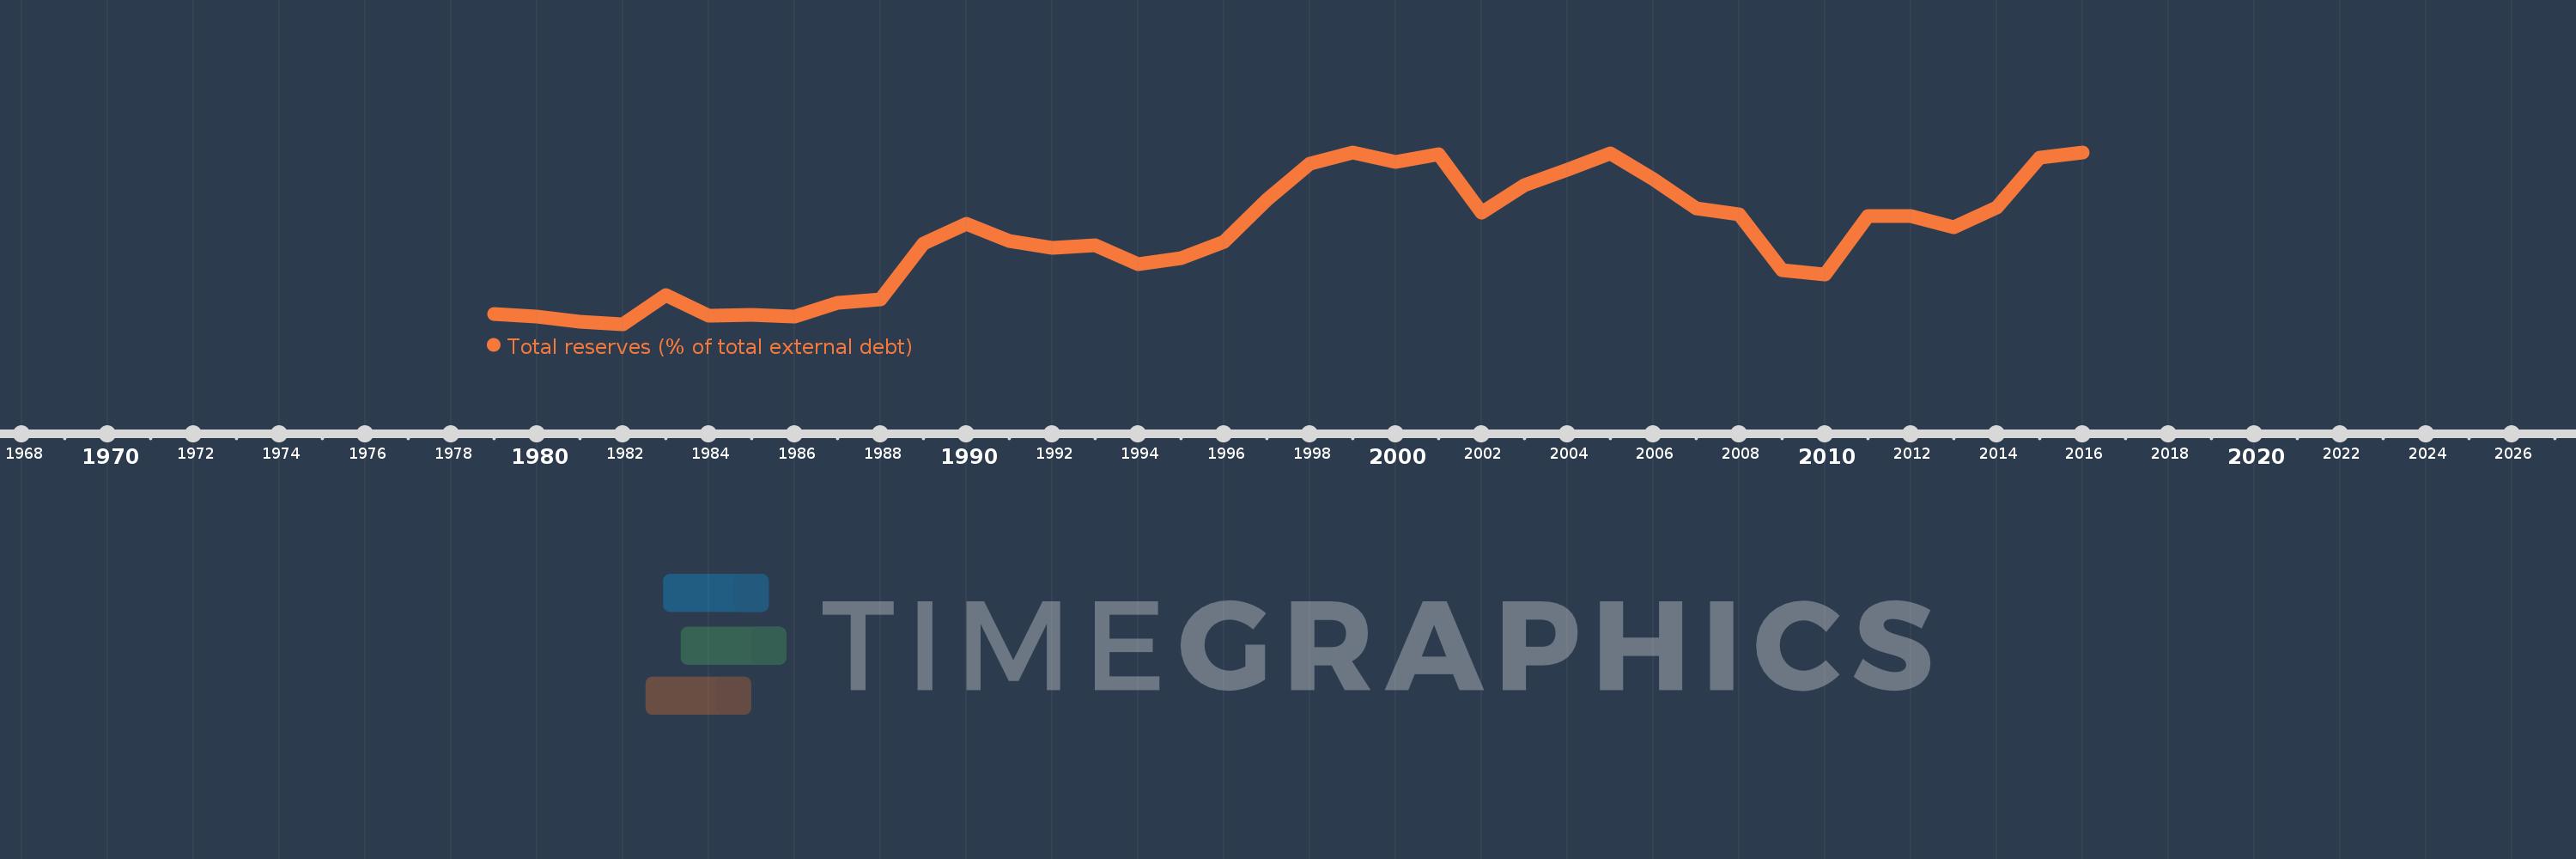
Nesta escala de tempo está apresentado um gráfico de 1979 ano até 2016 ano Maldives. Dados de 1978 ano ausente. O número de observações reais por data: 38.
Fonte (nome):
Indicadores de desenvolvimento mundial
Fonte (organização):
World Bank, International Debt Statistics.
Categorias:
Financial Sector, External Debt
Foi atualizado:
23 abr 2017 ano
Indicadores de alterações dos valores ao longo dos anos
Mínimo:
2.946
1 jan 1982 ano
Máximo:
61.227
1 jan 1999 ano
Na data de observação
Valor
Mudança absoluta
A alteração em relação ao valor anterior
1 jan 1979 ano
6.432
+6.432
0.0%
1 jan 1980 ano
5.56
-0.872
-13.55%
1 jan 1981 ano
3.684
-1.876
-33.74%
1 jan 1982 ano
2.946
-0.739
-20.05%
1 jan 1983 ano
12.919
+9.974
338.6%
1 jan 1984 ano
5.881
-7.039
-54.48%
1 jan 1985 ano
6.195
+0.314
5.34%
1 jan 1986 ano
5.528
-0.667
-10.76%
1 jan 1987 ano
10.067
+4.539
82.1%
1 jan 1988 ano
11.25
+1.183
11.75%
1 jan 1989 ano
30.25
+19.0
168.89%
1 jan 1990 ano
37.075
+6.825
22.56%
1 jan 1991 ano
31.268
-5.808
-15.66%
1 jan 1992 ano
28.887
-2.381
-7.61%
1 jan 1993 ano
29.709
+0.822
2.85%
1 jan 1994 ano
23.276
-6.434
-21.66%
1 jan 1995 ano
25.275
+1.999
8.59%
1 jan 1996 ano
30.963
+5.688
22.51%
1 jan 1997 ano
45.283
+14.32
46.25%
1 jan 1998 ano
57.376
+12.094
26.71%
1 jan 1999 ano
61.227
+3.85
6.71%
1 jan 2000 ano
57.98
-3.247
-5.3%
1 jan 2001 ano
60.487
+2.507
4.32%
1 jan 2002 ano
40.914
-19.573
-32.36%
1 jan 2003 ano
50.266
+9.352
22.86%
1 jan 2004 ano
55.39
+5.124
10.19%
1 jan 2005 ano
60.795
+5.405
9.76%
1 jan 2006 ano
52.17
-8.625
-14.19%
1 jan 2007 ano
42.332
-9.839
-18.86%
1 jan 2008 ano
40.349
-1.983
-4.68%
1 jan 2009 ano
21.23
-19.119
-47.39%
1 jan 2010 ano
19.921
-1.309
-6.17%
1 jan 2011 ano
39.747
+19.826
99.52%
1 jan 2012 ano
39.531
-0.216
-0.54%
1 jan 2013 ano
35.762
-3.769
-9.53%
1 jan 2014 ano
42.408
+6.646
18.58%
1 jan 2015 ano
59.522
+17.114
40.36%
1 jan 2016 ano
61.055
+1.533
2.58%
Classificação de países por estatísticas atuais por anos


Comentários: