29
/pt/
pt
AIzaSyAYiBZKx7MnpbEhh9jyipgxe19OcubqV5w
April 1, 2024
188580
Malaysia
MYS
true
2
1
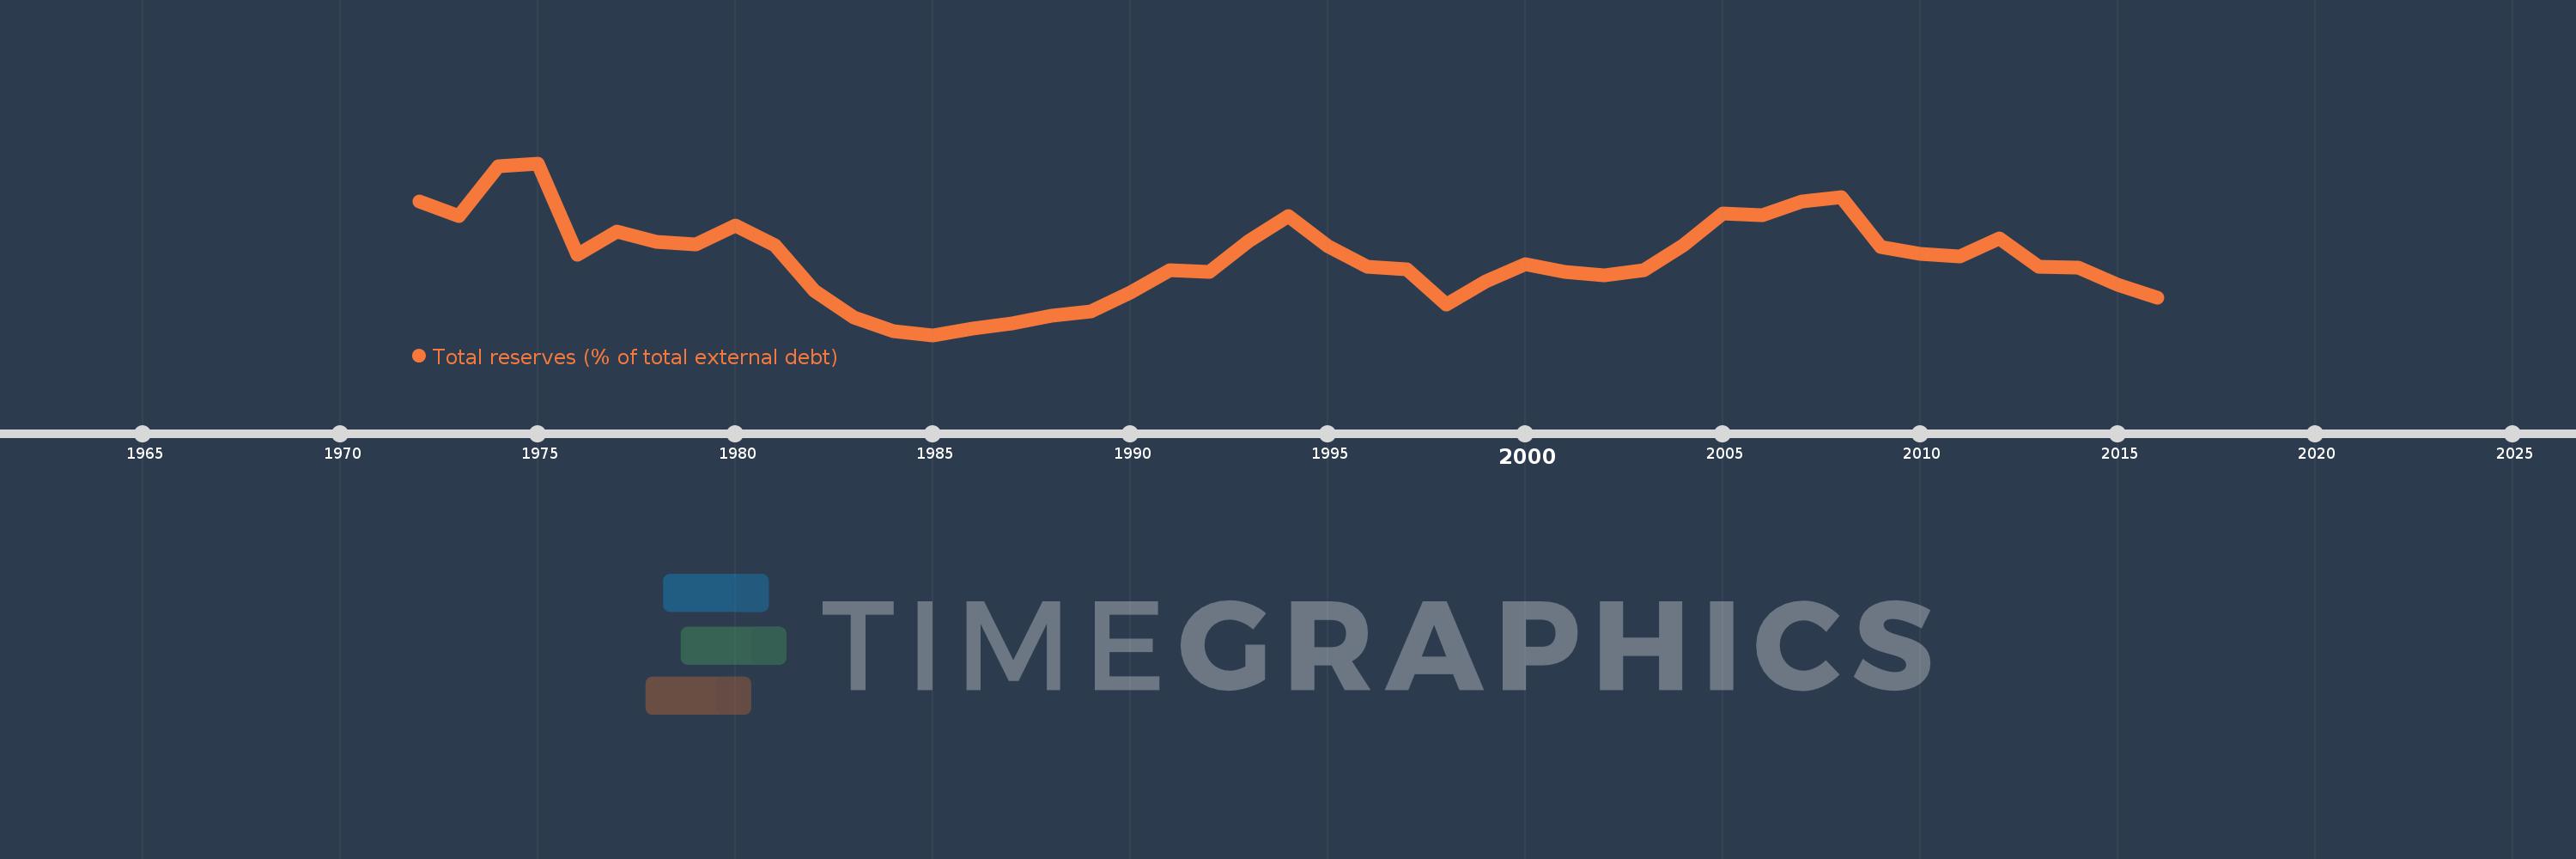
Total reserves (% of total external debt)
2016,2015,2014,2013,2012,2011,2010,2009,2008,2007,2006,2005,2004,2003,2002,2001,2000,1999,1998,1997,1996,1995,1994,1993,1992,1991,1990,1989,1988,1987,1986,1985,1984,1983,1982,1981,1980,1979,1978,1977,1976,1975,1974,1973,1972
Estas estatísticas em outros países:
Linha do tempo:
Nesta escala de tempo está apresentado um gráfico de 1972 ano até 2016 ano Malaysia. Dados de 1971 ano ausente. O número de observações reais por data: 45.
Fonte (nome):
Indicadores de desenvolvimento mundial
Fonte (organização):
World Bank, International Debt Statistics.
Categorias:
Financial Sector, External Debt
Foi atualizado:
23 abr 2017 ano
Indicadores de alterações dos valores ao longo dos anos
Mínimo:
23.704
1 jan 1985 ano
Máximo:
145.267
1 jan 1975 ano
Na data de observação
Valor
Mudança absoluta
A alteração em relação ao valor anterior
1 jan 1972 ano
117.978
+117.978
0.0%
1 jan 1973 ano
107.972
-10.006
-8.48%
1 jan 1974 ano
143.338
+35.366
32.76%
1 jan 1975 ano
145.267
+1.928
1.35%
1 jan 1976 ano
80.264
-65.003
-44.75%
1 jan 1977 ano
96.869
+16.605
20.69%
1 jan 1978 ano
89.659
-7.21
-7.44%
1 jan 1979 ano
88.086
-1.573
-1.75%
1 jan 1980 ano
101.009
+12.924
14.67%
1 jan 1981 ano
87.056
-13.954
-13.81%
1 jan 1982 ano
54.732
-32.323
-37.13%
1 jan 1983 ano
36.187
-18.545
-33.88%
1 jan 1984 ano
26.619
-9.569
-26.44%
1 jan 1985 ano
23.704
-2.914
-10.95%
1 jan 1986 ano
28.003
+4.298
18.13%
1 jan 1987 ano
31.724
+3.721
13.29%
1 jan 1988 ano
37.532
+5.808
18.31%
1 jan 1989 ano
40.338
+2.806
7.48%
1 jan 1990 ano
53.645
+13.307
32.99%
1 jan 1991 ano
69.53
+15.885
29.61%
1 jan 1992 ano
68.596
-0.934
-1.34%
1 jan 1993 ano
90.038
+21.442
31.26%
1 jan 1994 ano
107.78
+17.742
19.71%
1 jan 1995 ano
86.824
-20.956
-19.44%
1 jan 1996 ano
71.919
-14.905
-17.17%
1 jan 1997 ano
70.304
-1.615
-2.25%
1 jan 1998 ano
45.46
-24.844
-35.34%
1 jan 1999 ano
61.863
+16.403
36.08%
1 jan 2000 ano
73.686
+11.823
19.11%
1 jan 2001 ano
68.304
-5.382
-7.3%
1 jan 2002 ano
66.092
-2.212
-3.24%
1 jan 2003 ano
69.837
+3.745
5.67%
1 jan 2004 ano
87.27
+17.433
24.96%
1 jan 2005 ano
109.722
+22.452
25.73%
1 jan 2006 ano
108.545
-1.177
-1.07%
1 jan 2007 ano
118.309
+9.763
8.99%
1 jan 2008 ano
121.112
+2.803
2.37%
1 jan 2009 ano
86.221
-34.891
-28.81%
1 jan 2010 ano
80.849
-5.372
-6.23%
1 jan 2011 ano
79.618
-1.231
-1.52%
1 jan 2012 ano
92.183
+12.565
15.78%
1 jan 2013 ano
72.071
-20.112
-21.82%
1 jan 2014 ano
71.429
-0.642
-0.89%
1 jan 2015 ano
58.986
-12.443
-17.42%
1 jan 2016 ano
49.899
-9.087
-15.41%
Classificação de países por estatísticas atuais por anos


Comentários: