29
/pt/
pt
AIzaSyAYiBZKx7MnpbEhh9jyipgxe19OcubqV5w
April 1, 2024
156825
Indonesia
IDN
true
2
1
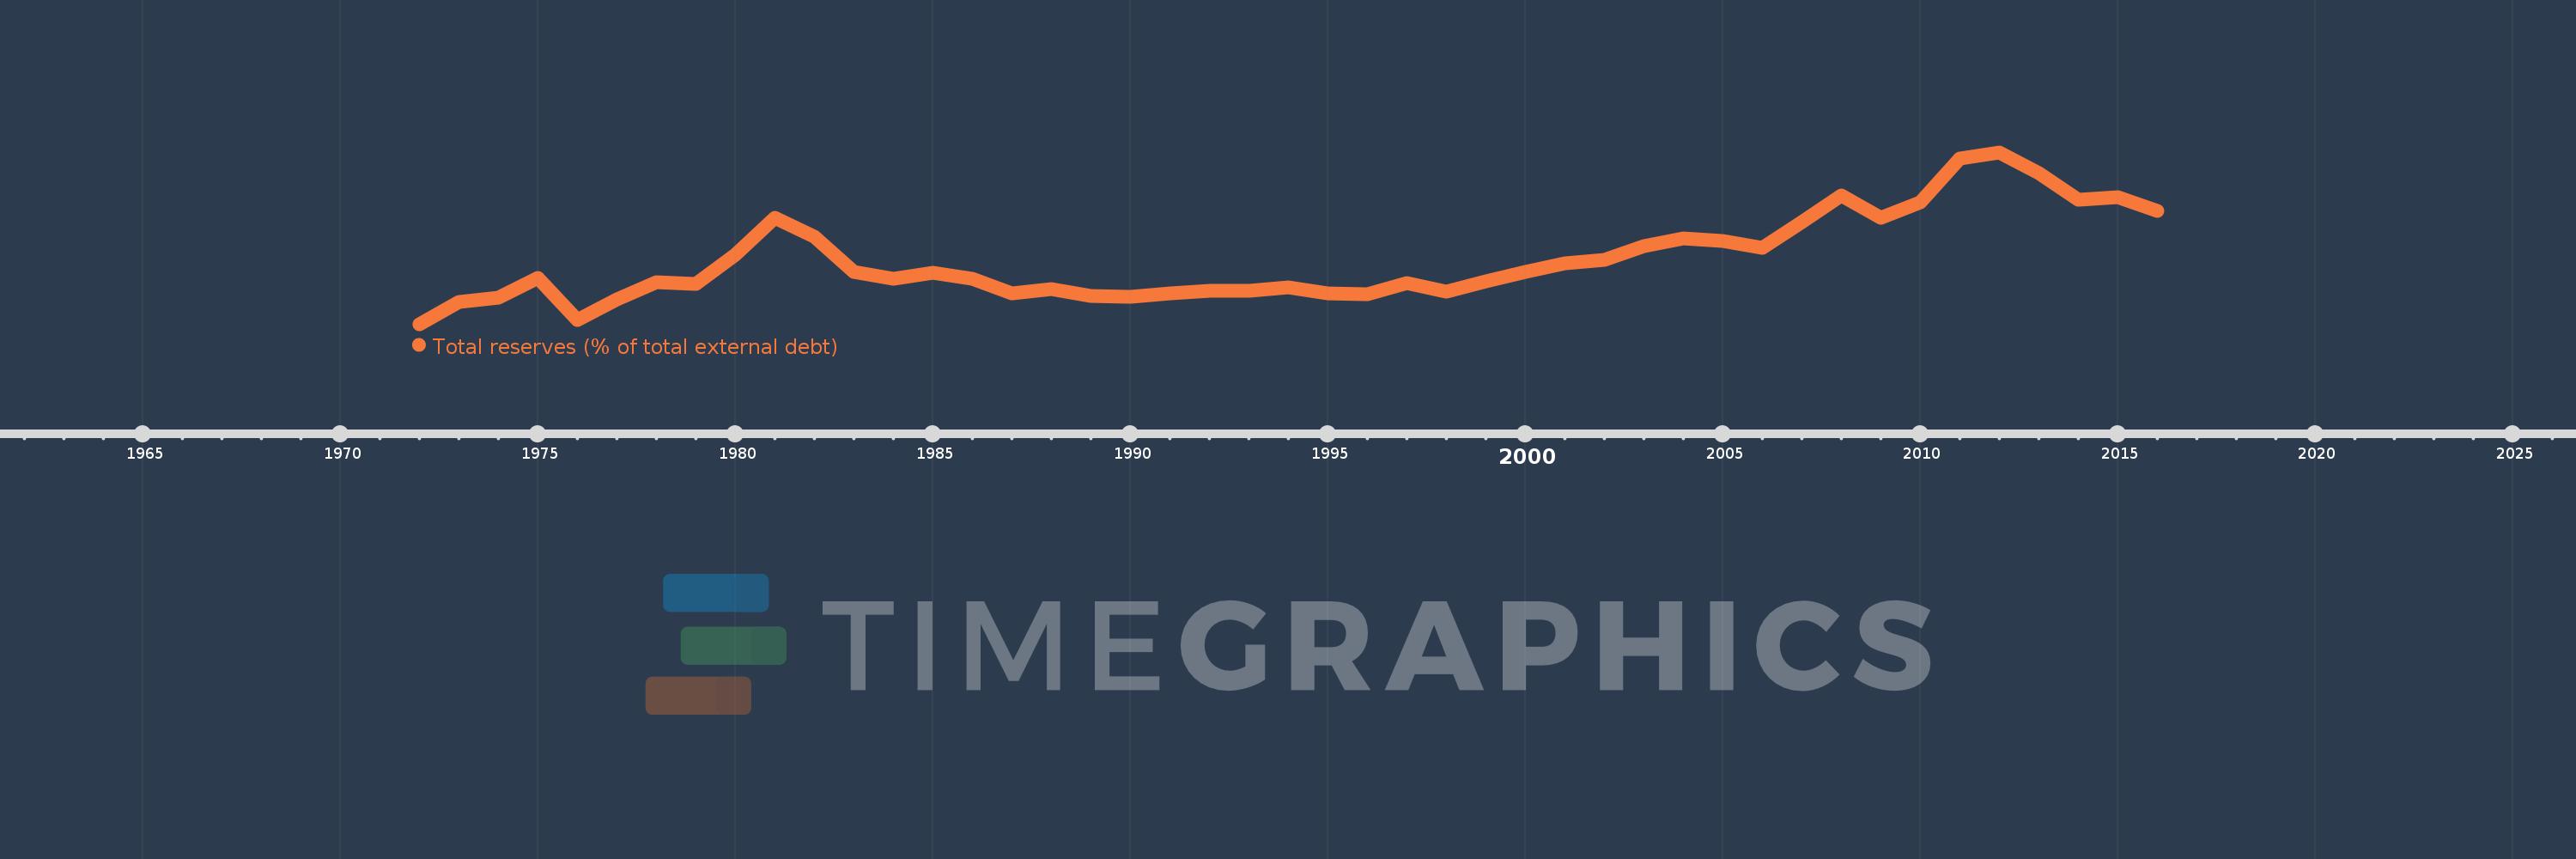
Total reserves (% of total external debt)
2016,2015,2014,2013,2012,2011,2010,2009,2008,2007,2006,2005,2004,2003,2002,2001,2000,1999,1998,1997,1996,1995,1994,1993,1992,1991,1990,1989,1988,1987,1986,1985,1984,1983,1982,1981,1980,1979,1978,1977,1976,1975,1974,1973,1972
Estas estatísticas em outros países:
Linha do tempo:
Nesta escala de tempo está apresentado um gráfico de 1972 ano até 2016 ano Indonesia. Dados de 1971 ano ausente. O número de observações reais por data: 45.
Fonte (nome):
Indicadores de desenvolvimento mundial
Fonte (organização):
World Bank, International Debt Statistics.
Categorias:
Financial Sector, External Debt
Foi atualizado:
23 abr 2017 ano
Indicadores de alterações dos valores ao longo dos anos
Mínimo:
4.011
1 jan 1972 ano
Máximo:
50.149
1 jan 2012 ano
Na data de observação
Valor
Mudança absoluta
A alteração em relação ao valor anterior
1 jan 1972 ano
4.011
+4.011
0.0%
1 jan 1973 ano
9.976
+5.965
148.7%
1 jan 1974 ano
11.156
+1.18
11.83%
1 jan 1975 ano
16.483
+5.327
47.75%
1 jan 1976 ano
5.152
-11.332
-68.75%
1 jan 1977 ano
10.737
+5.585
108.41%
1 jan 1978 ano
15.401
+4.664
43.44%
1 jan 1979 ano
14.833
-0.568
-3.69%
1 jan 1980 ano
22.58
+7.747
52.22%
1 jan 1981 ano
32.491
+9.912
43.9%
1 jan 1982 ano
27.45
-5.041
-15.52%
1 jan 1983 ano
18.154
-9.296
-33.87%
1 jan 1984 ano
16.218
-1.936
-10.66%
1 jan 1985 ano
17.892
+1.674
10.32%
1 jan 1986 ano
16.313
-1.579
-8.83%
1 jan 1987 ano
12.268
-4.045
-24.8%
1 jan 1988 ano
13.507
+1.24
10.11%
1 jan 1989 ano
11.695
-1.812
-13.42%
1 jan 1990 ano
11.282
-0.413
-3.53%
1 jan 1991 ano
12.394
+1.111
9.85%
1 jan 1992 ano
13.025
+0.631
5.1%
1 jan 1993 ano
13.051
+0.026
0.2%
1 jan 1994 ano
13.993
+0.942
7.22%
1 jan 1995 ano
12.356
-1.636
-11.7%
1 jan 1996 ano
11.985
-0.372
-3.01%
1 jan 1997 ano
15.037
+3.052
25.47%
1 jan 1998 ano
12.828
-2.21
-14.69%
1 jan 1999 ano
15.585
+2.757
21.5%
1 jan 2000 ano
18.015
+2.43
15.59%
1 jan 2001 ano
20.379
+2.364
13.12%
1 jan 2002 ano
21.179
+0.8
3.92%
1 jan 2003 ano
24.943
+3.763
17.77%
1 jan 2004 ano
26.985
+2.042
8.19%
1 jan 2005 ano
26.307
-0.678
-2.51%
1 jan 2006 ano
24.438
-1.869
-7.1%
1 jan 2007 ano
31.331
+6.893
28.21%
1 jan 2008 ano
38.518
+7.187
22.94%
1 jan 2009 ano
32.703
-5.814
-15.1%
1 jan 2010 ano
36.857
+4.153
12.7%
1 jan 2011 ano
48.526
+11.669
31.66%
1 jan 2012 ano
50.149
+1.623
3.35%
1 jan 2013 ano
44.663
-5.486
-10.94%
1 jan 2014 ano
37.44
-7.222
-16.17%
1 jan 2015 ano
38.182
+0.742
1.98%
1 jan 2016 ano
34.332
-3.85
-10.08%
Classificação de países por estatísticas atuais por anos


Comentários: