29
/it/
it
AIzaSyAYiBZKx7MnpbEhh9jyipgxe19OcubqV5w
April 1, 2024
83069
Belize
BLZ
true
2
1
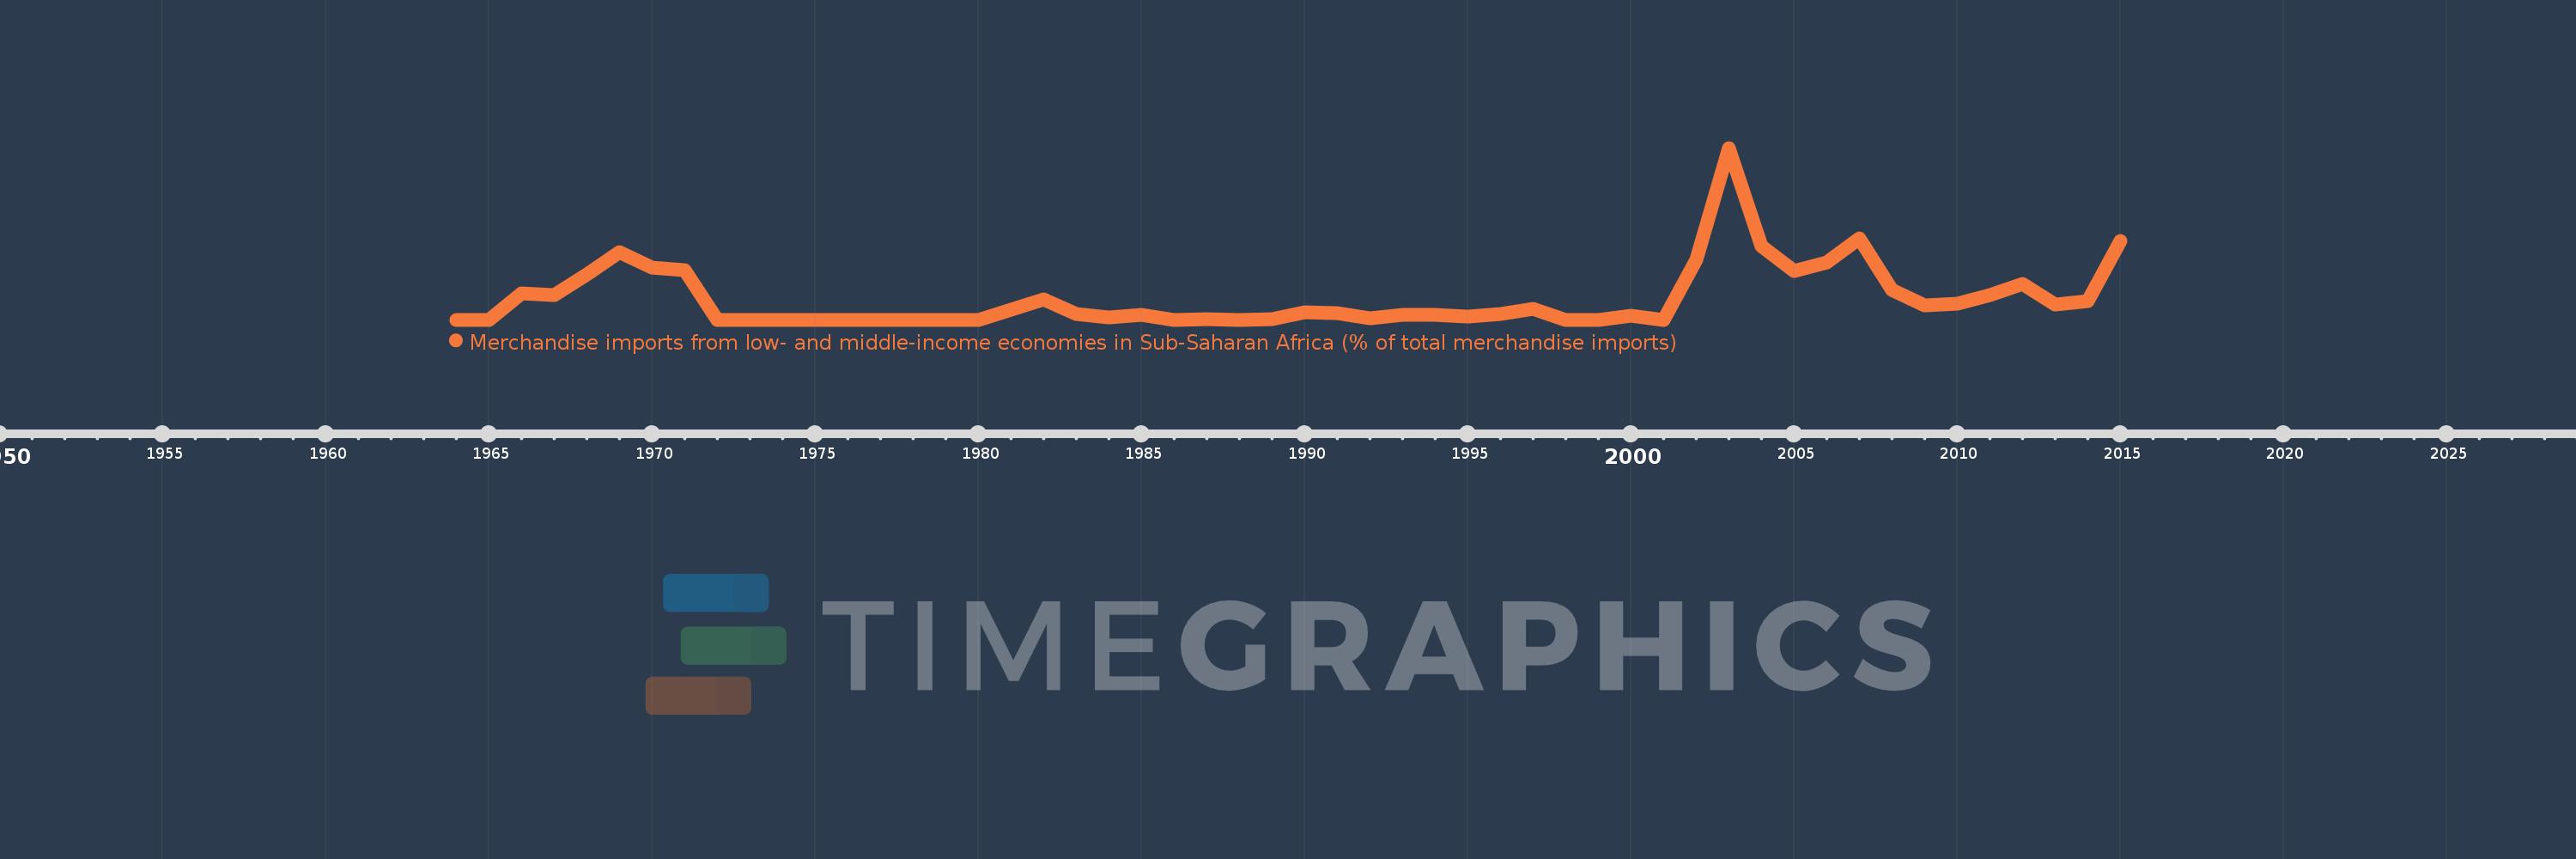
Merchandise imports from low- and middle-income economies in Sub-Saharan Africa (% of total merchandise imports)
2015,2014,2013,2012,2011,2010,2009,2008,2007,2006,2005,2004,2003,2002,2001,2000,1999,1998,1997,1996,1995,1994,1993,1992,1991,1990,1989,1988,1987,1986,1985,1984,1983,1982,1980,1979,1978,1977,1976,1975,1974,1973,1972,1971,1970,1969,1968,1967,1966,1965,1964
Queste statistiche in altri paesi:
AlbaniaAlgeriaAngolaArab WorldArgentinaArmeniaArubaAustraliaAustriaAzerbaijanBahamas, TheBahrainBangladeshBarbadosBelarusBelgiumBelizeBeninBermudaBoliviaBrazilBrunei DarussalamBulgariaBurkina FasoBurundiCabo VerdeCambodiaCameroonCanadaCaribbean small statesCentral African RepublicCentral Europe and the BalticsChadChileChinaColombiaCongo, Dem. Rep.Congo, Rep.Costa RicaCote d'IvoireCroatiaCubaCyprusCzech RepublicDenmarkDjiboutiDominicaDominican RepublicEarly-demographic dividendEast Asia & PacificEast Asia & Pacific (excluding high income)East Asia & Pacific (IDA & IBRD countries)EcuadorEgypt, Arab Rep.El SalvadorEstoniaEthiopiaEuro areaEurope & Central AsiaEurope & Central Asia (excluding high income)Europe & Central Asia (IDA & IBRD countries)European UnionFijiFinlandFragile and conflict affected situationsFranceGabonGambia, TheGeorgiaGermanyGhanaGreeceGreenlandGrenadaGuatemalaGuineaGuinea-BissauGuyanaHaitiHeavily indebted poor countries (HIPC)High incomeHondurasHong Kong SAR, ChinaHungaryIBRD onlyIcelandIDA & IBRD totalIDA blendIDA onlyIDA totalIndiaIndonesiaIran, Islamic Rep.IraqIrelandIsraelItalyJamaicaJapanJordanKazakhstanKenyaKorea, Dem. People’s Rep.Korea, Rep.KuwaitLao PDRLate-demographic dividendLatin America & Caribbean Latin America & Caribbean (excluding high income)Latin America & the Caribbean (IDA & IBRD countries)LatviaLeast developed countries: UN classificationLebanonLiberiaLibyaLithuaniaLow & middle incomeLow incomeLower middle incomeLuxembourgMacao SAR, ChinaMacedonia, FYRMadagascarMalawiMalaysiaMaliMaltaMauritaniaMauritiusMexicoMiddle East & North AfricaMiddle East & North Africa (excluding high income)Middle East & North Africa (IDA & IBRD countries)Middle incomeMoldovaMontenegroMoroccoMozambiqueMyanmarNetherlandsNew CaledoniaNew ZealandNicaraguaNigerNigeriaNorth AmericaNorwayOECD membersOmanOther small statesPacific island small statesPakistanPanamaPapua New GuineaParaguayPeruPhilippinesPolandPortugalPost-demographic dividendPre-demographic dividendQatarRomaniaRussian FederationRwandaSaudi ArabiaSenegalSerbiaSeychellesSierra LeoneSingaporeSlovak RepublicSloveniaSmall statesSomaliaSouth AfricaSouth AsiaSouth Asia (IDA & IBRD)SpainSri LankaSt. LuciaSt. Vincent and the GrenadinesSub-Saharan Africa Sub-Saharan Africa (excluding high income)Sub-Saharan Africa (IDA & IBRD countries)SudanSurinameSwedenSwitzerlandSyrian Arab RepublicTanzaniaThailandTogoTrinidad and TobagoTunisiaTurkeyUgandaUkraineUnited Arab EmiratesUnited KingdomUnited StatesUpper middle incomeUruguayVenezuela, RBVietnamWorldYemen, Rep.ZambiaZimbabwe Linea del tempo:
Questa scala temporale mostra un grafico dal 1964 anno al 2015 anno. Belize. I dati fino ad 1963 anno non disponibili. Il numero di osservazioni attuali secondo i date: 51.
La fonte (nome):
Indicatori dello sviluppo mondiale
La fonte (organizzazione):
World Bank staff estimates based data from International Monetary Fund's Direction of Trade database.
Categorie:
Private Sector, Trade
sono stati aggiornati
23 apr 2017 anni
Indicatori delle variazioni dei valori per anni
Minima:
0.0
1 gen 1964 anni
Massimo:
1.022
1 gen 2003 anni
Alla data di osservazione
Valore
Variazione assoluta
La variazione rispetto al valore precedente
1 gen 1964 anni
0.0
0.0
0.0%
1 gen 1966 anni
0.157
+0.157
%
1 gen 1967 anni
0.148
-0.009
-5.81%
1 gen 1968 anni
0.27
+0.123
83.21%
1 gen 1969 anni
0.403
+0.133
49.19%
1 gen 1970 anni
0.311
-0.093
-22.97%
1 gen 1971 anni
0.294
-0.017
-5.49%
1 gen 1972 anni
0.0
-0.294
-100.0%
1 gen 1982 anni
0.119
+0.119
%
1 gen 1983 anni
0.034
-0.085
-71.16%
1 gen 1984 anni
0.012
-0.023
-65.89%
1 gen 1985 anni
0.029
+0.018
149.37%
1 gen 1986 anni
0.0
-0.029
-100.0%
1 gen 1987 anni
0.006
+0.006
%
1 gen 1988 anni
0.001
-0.005
-87.76%
1 gen 1989 anni
0.002
+0.002
226.42%
1 gen 1990 anni
0.043
+0.04
1.76 Mille.%
1 gen 1991 anni
0.039
-0.004
-8.3%
1 gen 1992 anni
0.011
-0.028
-72.3%
1 gen 1993 anni
0.027
+0.017
152.07%
1 gen 1994 anni
0.028
+0.0
0.91%
1 gen 1995 anni
0.019
-0.009
-31.51%
1 gen 1996 anni
0.032
+0.014
71.56%
1 gen 1997 anni
0.065
+0.033
101.33%
1 gen 1998 anni
0.0
-0.065
-100.0%
1 gen 2000 anni
0.026
+0.026
%
1 gen 2001 anni
0.0
-0.026
-100.0%
1 gen 2002 anni
0.357
+0.357
%
1 gen 2003 anni
1.022
+0.664
185.9%
1 gen 2004 anni
0.437
-0.584
-57.21%
1 gen 2005 anni
0.291
-0.146
-33.42%
1 gen 2006 anni
0.341
+0.05
17.2%
1 gen 2007 anni
0.485
+0.144
42.13%
1 gen 2008 anni
0.178
-0.307
-63.36%
1 gen 2009 anni
0.087
-0.091
-51.13%
1 gen 2010 anni
0.098
+0.011
12.67%
1 gen 2011 anni
0.145
+0.047
48.42%
1 gen 2012 anni
0.212
+0.067
46.05%
1 gen 2013 anni
0.093
-0.119
-55.92%
1 gen 2014 anni
0.109
+0.015
16.19%
1 gen 2015 anni
0.467
+0.358
330.05%
Classificazione dei paesi secondo i statistiche attuali per anni


Commenti: