29
/it/
it
AIzaSyAYiBZKx7MnpbEhh9jyipgxe19OcubqV5w
April 1, 2024
130751
Ethiopia
ETH
true
2
1
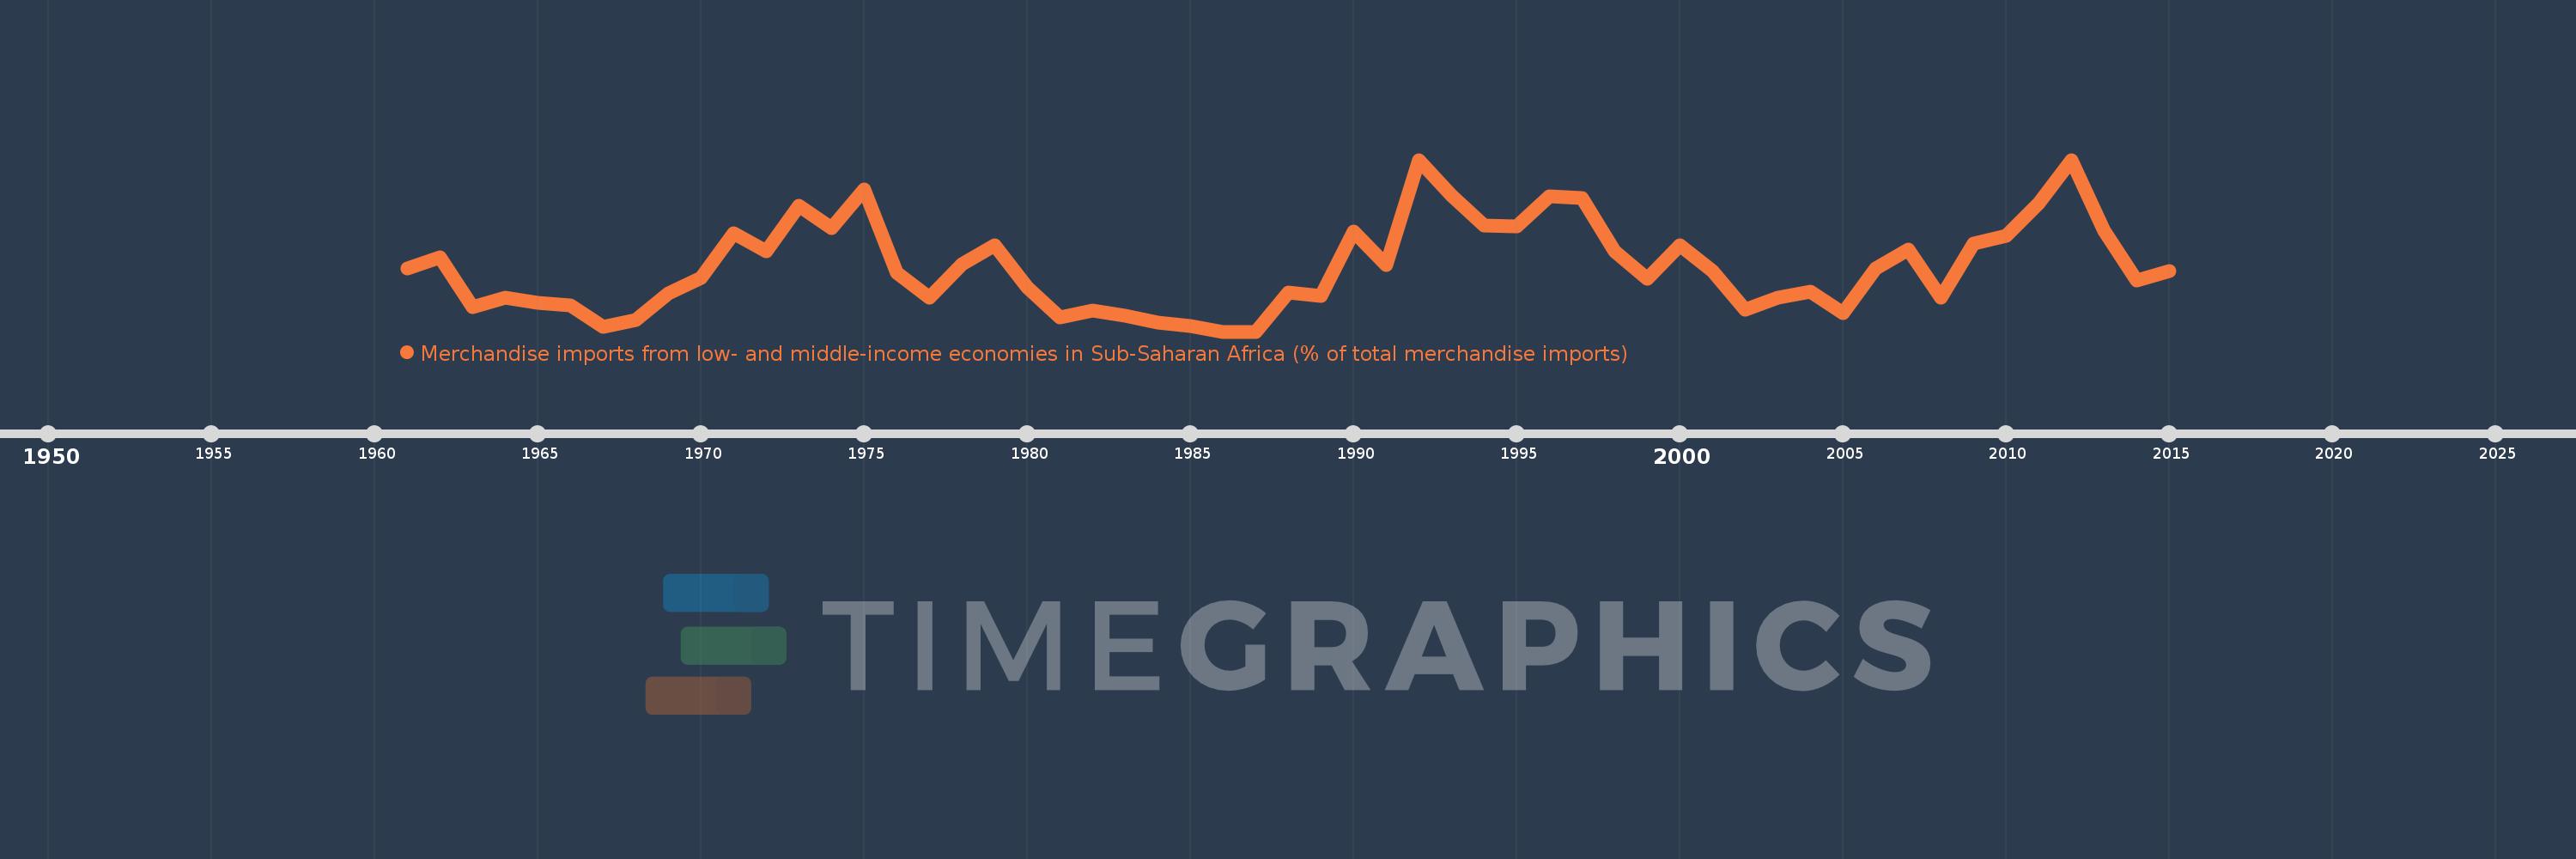
Merchandise imports from low- and middle-income economies in Sub-Saharan Africa (% of total merchandise imports)
2015,2014,2013,2012,2011,2010,2009,2008,2007,2006,2005,2004,2003,2002,2001,2000,1999,1998,1997,1996,1995,1994,1993,1992,1991,1990,1989,1988,1987,1986,1985,1984,1983,1982,1981,1980,1979,1978,1977,1976,1975,1974,1973,1972,1971,1970,1969,1968,1967,1966,1965,1964,1963,1962,1961
Queste statistiche in altri paesi:
AlbaniaAlgeriaAngolaArab WorldArgentinaArmeniaArubaAustraliaAustriaAzerbaijanBahamas, TheBahrainBangladeshBarbadosBelarusBelgiumBelizeBeninBermudaBoliviaBrazilBrunei DarussalamBulgariaBurkina FasoBurundiCabo VerdeCambodiaCameroonCanadaCaribbean small statesCentral African RepublicCentral Europe and the BalticsChadChileChinaColombiaCongo, Dem. Rep.Congo, Rep.Costa RicaCote d'IvoireCroatiaCubaCyprusCzech RepublicDenmarkDjiboutiDominicaDominican RepublicEarly-demographic dividendEast Asia & PacificEast Asia & Pacific (excluding high income)East Asia & Pacific (IDA & IBRD countries)EcuadorEgypt, Arab Rep.El SalvadorEstoniaEthiopiaEuro areaEurope & Central AsiaEurope & Central Asia (excluding high income)Europe & Central Asia (IDA & IBRD countries)European UnionFijiFinlandFragile and conflict affected situationsFranceGabonGambia, TheGeorgiaGermanyGhanaGreeceGreenlandGrenadaGuatemalaGuineaGuinea-BissauGuyanaHaitiHeavily indebted poor countries (HIPC)High incomeHondurasHong Kong SAR, ChinaHungaryIBRD onlyIcelandIDA & IBRD totalIDA blendIDA onlyIDA totalIndiaIndonesiaIran, Islamic Rep.IraqIrelandIsraelItalyJamaicaJapanJordanKazakhstanKenyaKorea, Dem. People’s Rep.Korea, Rep.KuwaitLao PDRLate-demographic dividendLatin America & Caribbean Latin America & Caribbean (excluding high income)Latin America & the Caribbean (IDA & IBRD countries)LatviaLeast developed countries: UN classificationLebanonLiberiaLibyaLithuaniaLow & middle incomeLow incomeLower middle incomeLuxembourgMacao SAR, ChinaMacedonia, FYRMadagascarMalawiMalaysiaMaliMaltaMauritaniaMauritiusMexicoMiddle East & North AfricaMiddle East & North Africa (excluding high income)Middle East & North Africa (IDA & IBRD countries)Middle incomeMoldovaMontenegroMoroccoMozambiqueMyanmarNetherlandsNew CaledoniaNew ZealandNicaraguaNigerNigeriaNorth AmericaNorwayOECD membersOmanOther small statesPacific island small statesPakistanPanamaPapua New GuineaParaguayPeruPhilippinesPolandPortugalPost-demographic dividendPre-demographic dividendQatarRomaniaRussian FederationRwandaSaudi ArabiaSenegalSerbiaSeychellesSierra LeoneSingaporeSlovak RepublicSloveniaSmall statesSomaliaSouth AfricaSouth AsiaSouth Asia (IDA & IBRD)SpainSri LankaSt. LuciaSt. Vincent and the GrenadinesSub-Saharan Africa Sub-Saharan Africa (excluding high income)Sub-Saharan Africa (IDA & IBRD countries)SudanSurinameSwedenSwitzerlandSyrian Arab RepublicTanzaniaThailandTogoTrinidad and TobagoTunisiaTurkeyUgandaUkraineUnited Arab EmiratesUnited KingdomUnited StatesUpper middle incomeUruguayVenezuela, RBVietnamWorldYemen, Rep.ZambiaZimbabwe Linea del tempo:
Questa scala temporale mostra un grafico dal 1961 anno al 2015 anno. Ethiopia. I dati fino ad 1960 anno non disponibili. Il numero di osservazioni attuali secondo i date: 55.
La fonte (nome):
Indicatori dello sviluppo mondiale
La fonte (organizzazione):
World Bank staff estimates based data from International Monetary Fund's Direction of Trade database.
Categorie:
Private Sector, Trade
sono stati aggiornati
23 apr 2017 anni
Indicatori delle variazioni dei valori per anni
Minima:
0.453
1 gen 1986 anni
Massimo:
4.141
1 gen 1992 anni
Alla data di osservazione
Valore
Variazione assoluta
La variazione rispetto al valore precedente
1 gen 1961 anni
1.801
+1.801
0.0%
1 gen 1962 anni
2.043
+0.242
13.46%
1 gen 1963 anni
0.97
-1.073
-52.52%
1 gen 1964 anni
1.173
+0.203
20.97%
1 gen 1965 anni
1.062
-0.111
-9.48%
1 gen 1966 anni
1.007
-0.055
-5.21%
1 gen 1967 anni
0.559
-0.448
-44.51%
1 gen 1968 anni
0.7
+0.142
25.35%
1 gen 1969 anni
1.281
+0.58
82.86%
1 gen 1970 anni
1.597
+0.317
24.74%
1 gen 1971 anni
2.567
+0.97
60.71%
1 gen 1972 anni
2.186
-0.381
-14.83%
1 gen 1973 anni
3.162
+0.976
44.63%
1 gen 1974 anni
2.679
-0.483
-15.27%
1 gen 1975 anni
3.496
+0.817
30.5%
1 gen 1976 anni
1.716
-1.78
-50.92%
1 gen 1977 anni
1.19
-0.526
-30.64%
1 gen 1978 anni
1.901
+0.71
59.7%
1 gen 1979 anni
2.311
+0.411
21.6%
1 gen 1980 anni
1.403
-0.908
-39.3%
1 gen 1981 anni
0.75
-0.653
-46.57%
1 gen 1982 anni
0.897
+0.148
19.73%
1 gen 1983 anni
0.801
-0.096
-10.73%
1 gen 1984 anni
0.65
-0.151
-18.9%
1 gen 1985 anni
0.572
-0.078
-11.96%
1 gen 1986 anni
0.453
-0.119
-20.82%
1 gen 1987 anni
0.453
+0.0
0.0%
1 gen 1988 anni
1.296
+0.843
186.24%
1 gen 1989 anni
1.22
-0.076
-5.88%
1 gen 1990 anni
2.602
+1.381
113.21%
1 gen 1991 anni
1.876
-0.725
-27.88%
1 gen 1992 anni
4.141
+2.264
120.7%
1 gen 1993 anni
3.381
-0.76
-18.34%
1 gen 1994 anni
2.725
-0.656
-19.4%
1 gen 1995 anni
2.72
-0.005
-0.19%
1 gen 1996 anni
3.36
+0.64
23.54%
1 gen 1997 anni
3.314
-0.046
-1.37%
1 gen 1998 anni
2.173
-1.141
-34.44%
1 gen 1999 anni
1.595
-0.578
-26.6%
1 gen 2000 anni
2.312
+0.717
44.95%
1 gen 2001 anni
1.75
-0.562
-24.29%
1 gen 2002 anni
0.921
-0.829
-47.35%
1 gen 2003 anni
1.178
+0.257
27.84%
1 gen 2004 anni
1.306
+0.128
10.88%
1 gen 2005 anni
0.858
-0.448
-34.3%
1 gen 2006 anni
1.801
+0.943
109.9%
1 gen 2007 anni
2.22
+0.419
23.25%
1 gen 2008 anni
1.18
-1.04
-46.83%
1 gen 2009 anni
2.35
+1.17
99.11%
1 gen 2010 anni
2.514
+0.163
6.95%
1 gen 2011 anni
3.204
+0.69
27.44%
1 gen 2012 anni
4.126
+0.923
28.81%
1 gen 2013 anni
2.623
-1.504
-36.44%
1 gen 2014 anni
1.546
-1.076
-41.05%
1 gen 2015 anni
1.762
+0.216
13.94%
Classificazione dei paesi secondo i statistiche attuali per anni


Commenti: