29
/it/
it
AIzaSyAYiBZKx7MnpbEhh9jyipgxe19OcubqV5w
April 1, 2024
79704
Barbados
BRB
true
2
1
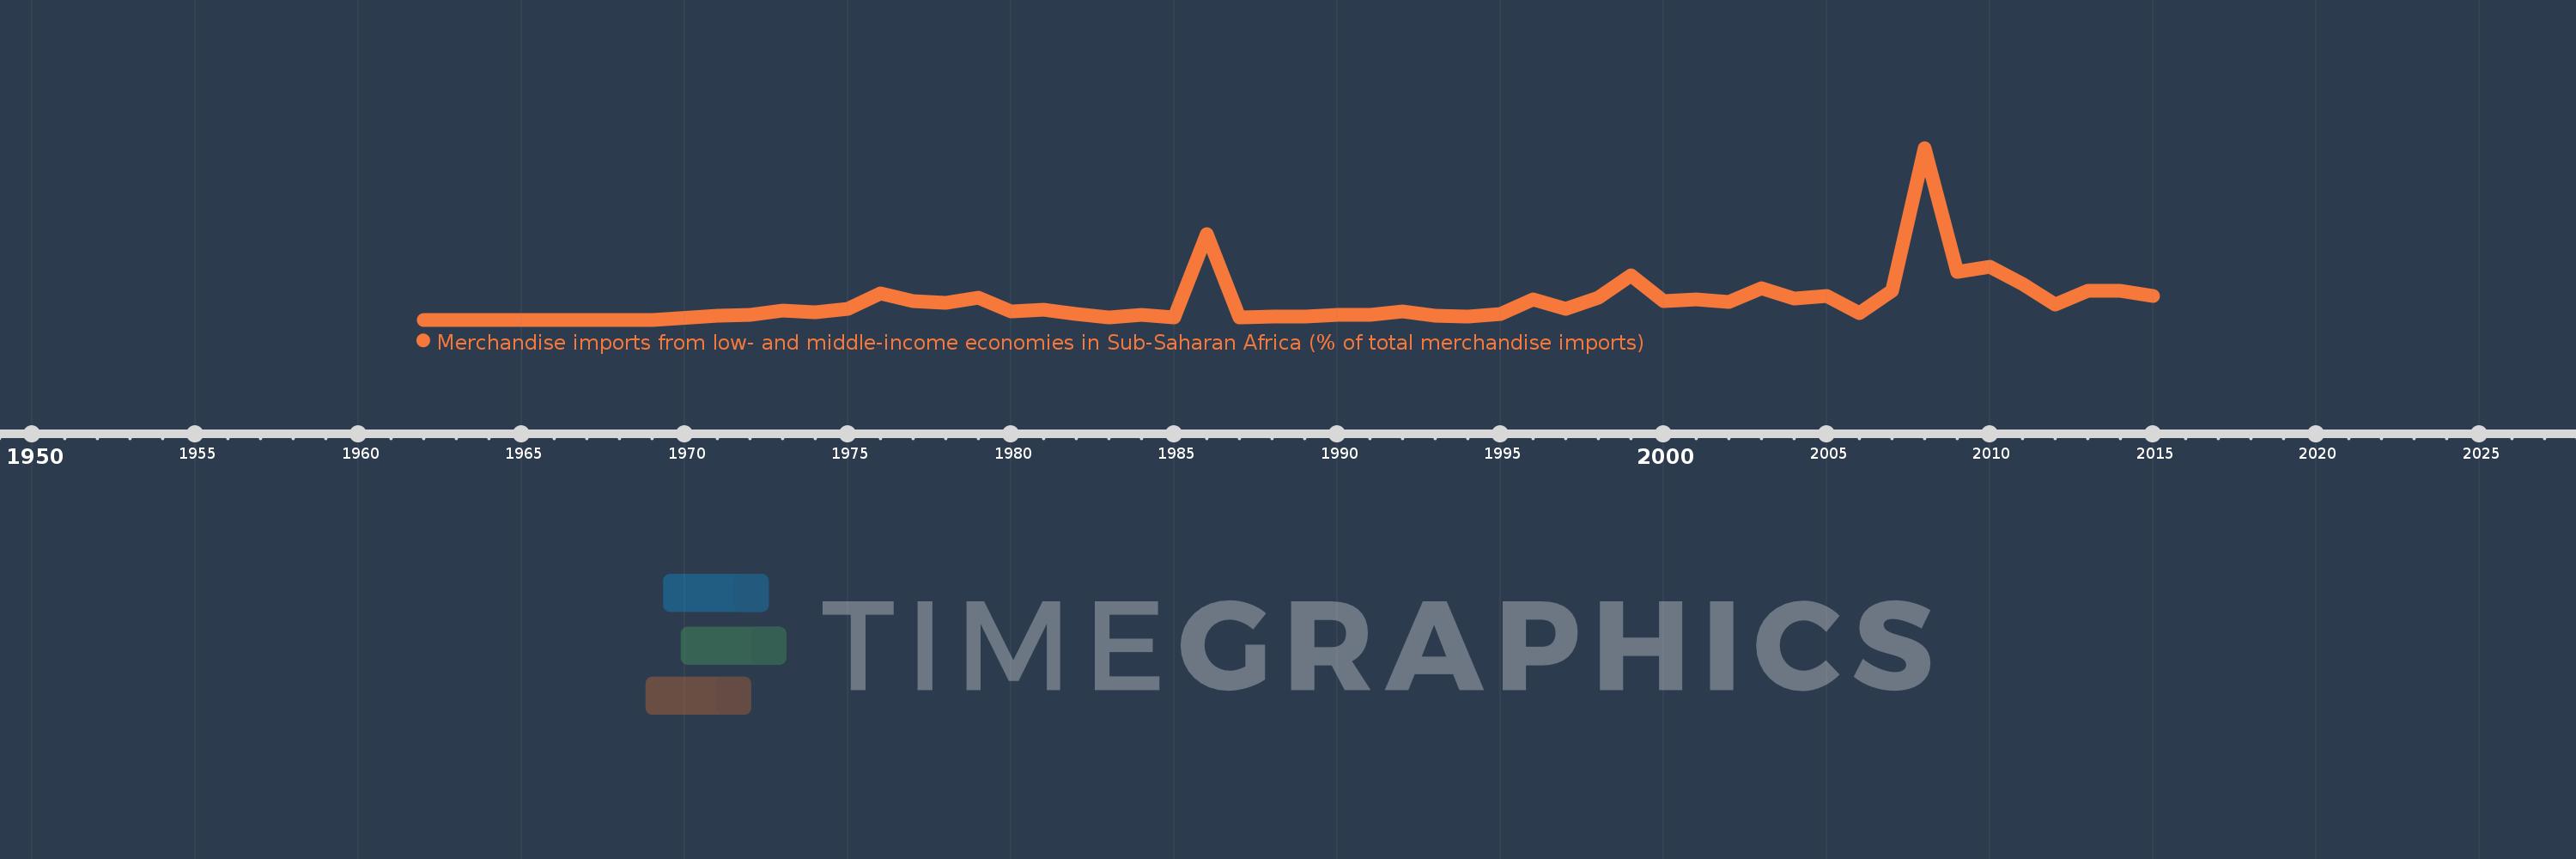
Merchandise imports from low- and middle-income economies in Sub-Saharan Africa (% of total merchandise imports)
2015,2014,2013,2012,2011,2010,2009,2008,2007,2006,2005,2004,2003,2002,2001,2000,1999,1998,1997,1996,1995,1994,1993,1992,1991,1990,1989,1988,1987,1986,1985,1984,1983,1982,1981,1980,1979,1978,1977,1976,1975,1974,1973,1972,1971,1969,1968,1967,1966,1965,1964,1963,1962
Queste statistiche in altri paesi:
AlbaniaAlgeriaAngolaArab WorldArgentinaArmeniaArubaAustraliaAustriaAzerbaijanBahamas, TheBahrainBangladeshBarbadosBelarusBelgiumBelizeBeninBermudaBoliviaBrazilBrunei DarussalamBulgariaBurkina FasoBurundiCabo VerdeCambodiaCameroonCanadaCaribbean small statesCentral African RepublicCentral Europe and the BalticsChadChileChinaColombiaCongo, Dem. Rep.Congo, Rep.Costa RicaCote d'IvoireCroatiaCubaCyprusCzech RepublicDenmarkDjiboutiDominicaDominican RepublicEarly-demographic dividendEast Asia & PacificEast Asia & Pacific (excluding high income)East Asia & Pacific (IDA & IBRD countries)EcuadorEgypt, Arab Rep.El SalvadorEstoniaEthiopiaEuro areaEurope & Central AsiaEurope & Central Asia (excluding high income)Europe & Central Asia (IDA & IBRD countries)European UnionFijiFinlandFragile and conflict affected situationsFranceGabonGambia, TheGeorgiaGermanyGhanaGreeceGreenlandGrenadaGuatemalaGuineaGuinea-BissauGuyanaHaitiHeavily indebted poor countries (HIPC)High incomeHondurasHong Kong SAR, ChinaHungaryIBRD onlyIcelandIDA & IBRD totalIDA blendIDA onlyIDA totalIndiaIndonesiaIran, Islamic Rep.IraqIrelandIsraelItalyJamaicaJapanJordanKazakhstanKenyaKorea, Dem. People’s Rep.Korea, Rep.KuwaitLao PDRLate-demographic dividendLatin America & Caribbean Latin America & Caribbean (excluding high income)Latin America & the Caribbean (IDA & IBRD countries)LatviaLeast developed countries: UN classificationLebanonLiberiaLibyaLithuaniaLow & middle incomeLow incomeLower middle incomeLuxembourgMacao SAR, ChinaMacedonia, FYRMadagascarMalawiMalaysiaMaliMaltaMauritaniaMauritiusMexicoMiddle East & North AfricaMiddle East & North Africa (excluding high income)Middle East & North Africa (IDA & IBRD countries)Middle incomeMoldovaMontenegroMoroccoMozambiqueMyanmarNetherlandsNew CaledoniaNew ZealandNicaraguaNigerNigeriaNorth AmericaNorwayOECD membersOmanOther small statesPacific island small statesPakistanPanamaPapua New GuineaParaguayPeruPhilippinesPolandPortugalPost-demographic dividendPre-demographic dividendQatarRomaniaRussian FederationRwandaSaudi ArabiaSenegalSerbiaSeychellesSierra LeoneSingaporeSlovak RepublicSloveniaSmall statesSomaliaSouth AfricaSouth AsiaSouth Asia (IDA & IBRD)SpainSri LankaSt. LuciaSt. Vincent and the GrenadinesSub-Saharan Africa Sub-Saharan Africa (excluding high income)Sub-Saharan Africa (IDA & IBRD countries)SudanSurinameSwedenSwitzerlandSyrian Arab RepublicTanzaniaThailandTogoTrinidad and TobagoTunisiaTurkeyUgandaUkraineUnited Arab EmiratesUnited KingdomUnited StatesUpper middle incomeUruguayVenezuela, RBVietnamWorldYemen, Rep.ZambiaZimbabwe Linea del tempo:
Questa scala temporale mostra un grafico dal 1962 anno al 2015 anno. Barbados. I dati fino ad 1961 anno non disponibili. Il numero di osservazioni attuali secondo i date: 53.
La fonte (nome):
Indicatori dello sviluppo mondiale
La fonte (organizzazione):
World Bank staff estimates based data from International Monetary Fund's Direction of Trade database.
Categorie:
Private Sector, Trade
sono stati aggiornati
23 apr 2017 anni
Indicatori delle variazioni dei valori per anni
Minima:
0.0
1 gen 1962 anni
Massimo:
0.97
1 gen 2008 anni
Alla data di osservazione
Valore
Variazione assoluta
La variazione rispetto al valore precedente
1 gen 1962 anni
0.0
0.0
0.0%
1 gen 1971 anni
0.021
+0.021
%
1 gen 1972 anni
0.029
+0.009
40.85%
1 gen 1973 anni
0.05
+0.021
70.45%
1 gen 1974 anni
0.04
-0.01
-20.75%
1 gen 1975 anni
0.062
+0.022
55.28%
1 gen 1976 anni
0.15
+0.088
142.27%
1 gen 1977 anni
0.103
-0.047
-31.11%
1 gen 1978 anni
0.095
-0.008
-7.34%
1 gen 1979 anni
0.123
+0.028
29.04%
1 gen 1980 anni
0.048
-0.075
-60.96%
1 gen 1981 anni
0.055
+0.007
14.32%
1 gen 1982 anni
0.032
-0.023
-41.36%
1 gen 1983 anni
0.015
-0.017
-52.87%
1 gen 1984 anni
0.029
+0.013
88.44%
1 gen 1985 anni
0.012
-0.017
-59.59%
1 gen 1986 anni
0.483
+0.471
4.07 Mille.%
1 gen 1987 anni
0.015
-0.468
-96.9%
1 gen 1988 anni
0.02
+0.005
30.95%
1 gen 1989 anni
0.017
-0.003
-14.64%
1 gen 1990 anni
0.027
+0.01
59.88%
1 gen 1991 anni
0.027
+0.0
0.86%
1 gen 1992 anni
0.046
+0.019
70.88%
1 gen 1993 anni
0.024
-0.022
-48.29%
1 gen 1994 anni
0.017
-0.007
-29.21%
1 gen 1995 anni
0.031
+0.014
85.49%
1 gen 1996 anni
0.116
+0.085
270.92%
1 gen 1997 anni
0.06
-0.057
-48.67%
1 gen 1998 anni
0.127
+0.067
112.63%
1 gen 1999 anni
0.25
+0.123
96.64%
1 gen 2000 anni
0.107
-0.143
-57.19%
1 gen 2001 anni
0.113
+0.006
5.34%
1 gen 2002 anni
0.102
-0.01
-9.11%
1 gen 2003 anni
0.178
+0.076
74.54%
1 gen 2004 anni
0.118
-0.061
-34.1%
1 gen 2005 anni
0.136
+0.018
15.46%
1 gen 2006 anni
0.038
-0.098
-72.06%
1 gen 2007 anni
0.163
+0.125
330.0%
1 gen 2008 anni
0.97
+0.807
494.46%
1 gen 2009 anni
0.269
-0.701
-72.28%
1 gen 2010 anni
0.301
+0.032
11.88%
1 gen 2011 anni
0.2
-0.101
-33.54%
1 gen 2012 anni
0.087
-0.113
-56.58%
1 gen 2013 anni
0.163
+0.076
87.3%
1 gen 2014 anni
0.164
+0.001
0.78%
1 gen 2015 anni
0.134
-0.03
-18.05%
Classificazione dei paesi secondo i statistiche attuali per anni


Commenti: