29
/it/
it
AIzaSyAYiBZKx7MnpbEhh9jyipgxe19OcubqV5w
April 1, 2024
117160
Cyprus
CYP
true
2
1
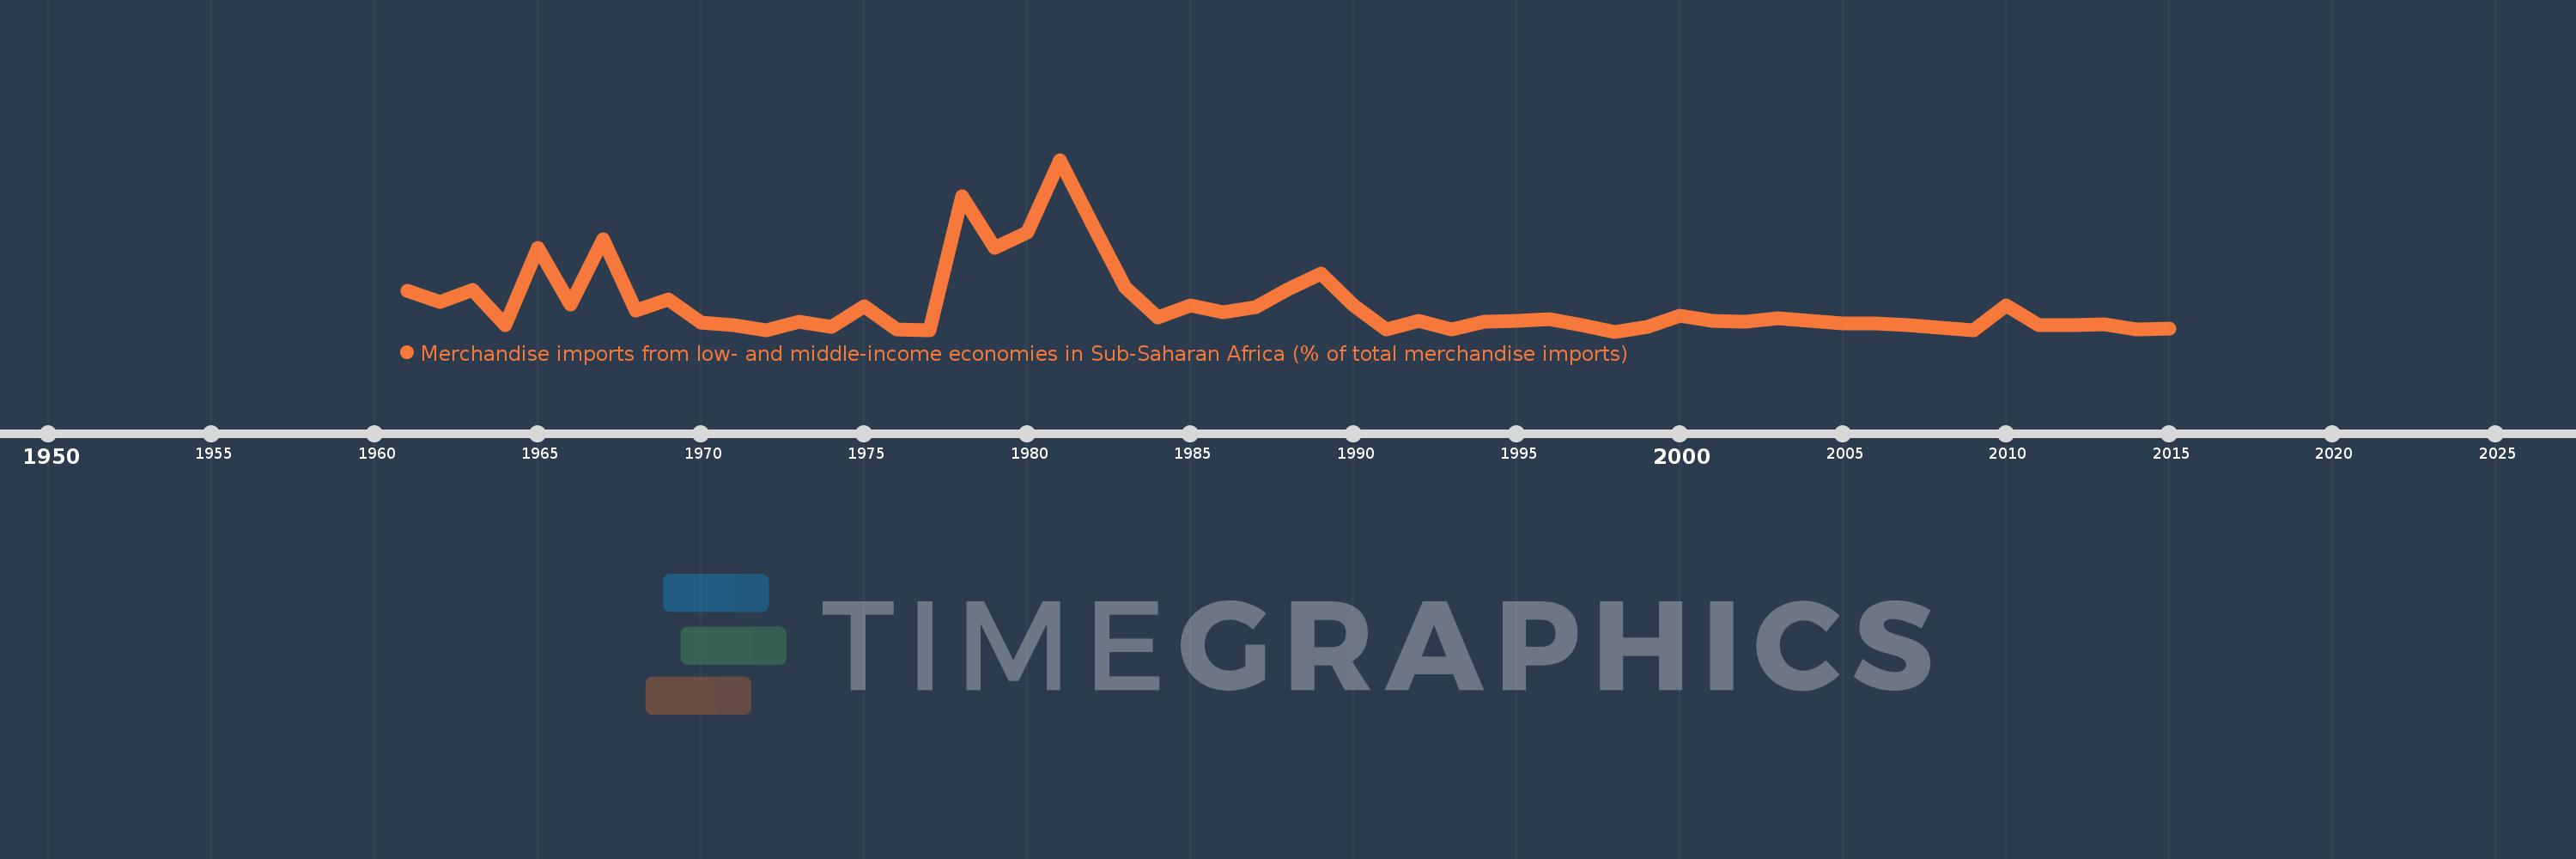
Merchandise imports from low- and middle-income economies in Sub-Saharan Africa (% of total merchandise imports)
2015,2014,2013,2012,2011,2010,2009,2008,2007,2006,2005,2004,2003,2002,2001,2000,1999,1998,1997,1996,1995,1994,1993,1992,1991,1990,1989,1988,1987,1986,1985,1984,1983,1982,1981,1980,1979,1978,1977,1976,1975,1974,1973,1972,1971,1970,1969,1968,1967,1966,1965,1964,1963,1962,1961
Queste statistiche in altri paesi:
AlbaniaAlgeriaAngolaArab WorldArgentinaArmeniaArubaAustraliaAustriaAzerbaijanBahamas, TheBahrainBangladeshBarbadosBelarusBelgiumBelizeBeninBermudaBoliviaBrazilBrunei DarussalamBulgariaBurkina FasoBurundiCabo VerdeCambodiaCameroonCanadaCaribbean small statesCentral African RepublicCentral Europe and the BalticsChadChileChinaColombiaCongo, Dem. Rep.Congo, Rep.Costa RicaCote d'IvoireCroatiaCubaCyprusCzech RepublicDenmarkDjiboutiDominicaDominican RepublicEarly-demographic dividendEast Asia & PacificEast Asia & Pacific (excluding high income)East Asia & Pacific (IDA & IBRD countries)EcuadorEgypt, Arab Rep.El SalvadorEstoniaEthiopiaEuro areaEurope & Central AsiaEurope & Central Asia (excluding high income)Europe & Central Asia (IDA & IBRD countries)European UnionFijiFinlandFragile and conflict affected situationsFranceGabonGambia, TheGeorgiaGermanyGhanaGreeceGreenlandGrenadaGuatemalaGuineaGuinea-BissauGuyanaHaitiHeavily indebted poor countries (HIPC)High incomeHondurasHong Kong SAR, ChinaHungaryIBRD onlyIcelandIDA & IBRD totalIDA blendIDA onlyIDA totalIndiaIndonesiaIran, Islamic Rep.IraqIrelandIsraelItalyJamaicaJapanJordanKazakhstanKenyaKorea, Dem. People’s Rep.Korea, Rep.KuwaitLao PDRLate-demographic dividendLatin America & Caribbean Latin America & Caribbean (excluding high income)Latin America & the Caribbean (IDA & IBRD countries)LatviaLeast developed countries: UN classificationLebanonLiberiaLibyaLithuaniaLow & middle incomeLow incomeLower middle incomeLuxembourgMacao SAR, ChinaMacedonia, FYRMadagascarMalawiMalaysiaMaliMaltaMauritaniaMauritiusMexicoMiddle East & North AfricaMiddle East & North Africa (excluding high income)Middle East & North Africa (IDA & IBRD countries)Middle incomeMoldovaMontenegroMoroccoMozambiqueMyanmarNetherlandsNew CaledoniaNew ZealandNicaraguaNigerNigeriaNorth AmericaNorwayOECD membersOmanOther small statesPacific island small statesPakistanPanamaPapua New GuineaParaguayPeruPhilippinesPolandPortugalPost-demographic dividendPre-demographic dividendQatarRomaniaRussian FederationRwandaSaudi ArabiaSenegalSerbiaSeychellesSierra LeoneSingaporeSlovak RepublicSloveniaSmall statesSomaliaSouth AfricaSouth AsiaSouth Asia (IDA & IBRD)SpainSri LankaSt. LuciaSt. Vincent and the GrenadinesSub-Saharan Africa Sub-Saharan Africa (excluding high income)Sub-Saharan Africa (IDA & IBRD countries)SudanSurinameSwedenSwitzerlandSyrian Arab RepublicTanzaniaThailandTogoTrinidad and TobagoTunisiaTurkeyUgandaUkraineUnited Arab EmiratesUnited KingdomUnited StatesUpper middle incomeUruguayVenezuela, RBVietnamWorldYemen, Rep.ZambiaZimbabwe Linea del tempo:
Questa scala temporale mostra un grafico dal 1961 anno al 2015 anno. Cyprus. I dati fino ad 1960 anno non disponibili. Il numero di osservazioni attuali secondo i date: 55.
La fonte (nome):
Indicatori dello sviluppo mondiale
La fonte (organizzazione):
World Bank staff estimates based data from International Monetary Fund's Direction of Trade database.
Categorie:
Private Sector, Trade
sono stati aggiornati
23 apr 2017 anni
Indicatori delle variazioni dei valori per anni
Minima:
0.17
1 gen 1998 anni
Massimo:
1.778
1 gen 1981 anni
Alla data di osservazione
Valore
Variazione assoluta
La variazione rispetto al valore precedente
1 gen 1961 anni
0.548
+0.548
0.0%
1 gen 1962 anni
0.446
-0.102
-18.67%
1 gen 1963 anni
0.562
+0.116
26.07%
1 gen 1964 anni
0.229
-0.333
-59.21%
1 gen 1965 anni
0.955
+0.726
316.75%
1 gen 1966 anni
0.42
-0.535
-55.98%
1 gen 1967 anni
1.037
+0.616
146.62%
1 gen 1968 anni
0.371
-0.666
-64.24%
1 gen 1969 anni
0.473
+0.103
27.65%
1 gen 1970 anni
0.257
-0.217
-45.78%
1 gen 1971 anni
0.227
-0.029
-11.42%
1 gen 1972 anni
0.179
-0.048
-21.14%
1 gen 1973 anni
0.264
+0.085
47.38%
1 gen 1974 anni
0.218
-0.046
-17.56%
1 gen 1975 anni
0.407
+0.189
86.61%
1 gen 1976 anni
0.192
-0.215
-52.87%
1 gen 1977 anni
0.179
-0.012
-6.47%
1 gen 1978 anni
1.436
+1.257
701.45%
1 gen 1979 anni
0.956
-0.48
-33.44%
1 gen 1980 anni
1.102
+0.146
15.27%
1 gen 1981 anni
1.778
+0.676
61.39%
1 gen 1982 anni
1.172
-0.606
-34.08%
1 gen 1983 anni
0.583
-0.59
-50.31%
1 gen 1984 anni
0.301
-0.281
-48.31%
1 gen 1985 anni
0.412
+0.111
36.76%
1 gen 1986 anni
0.349
-0.063
-15.24%
1 gen 1987 anni
0.396
+0.047
13.49%
1 gen 1988 anni
0.566
+0.17
42.85%
1 gen 1989 anni
0.715
+0.15
26.42%
1 gen 1990 anni
0.417
-0.299
-41.77%
1 gen 1991 anni
0.188
-0.228
-54.81%
1 gen 1992 anni
0.273
+0.085
45.03%
1 gen 1993 anni
0.194
-0.079
-28.9%
1 gen 1994 anni
0.266
+0.072
36.96%
1 gen 1995 anni
0.269
+0.003
1.18%
1 gen 1996 anni
0.289
+0.02
7.39%
1 gen 1997 anni
0.23
-0.059
-20.25%
1 gen 1998 anni
0.17
-0.06
-26.07%
1 gen 1999 anni
0.214
+0.043
25.5%
1 gen 2000 anni
0.317
+0.103
48.17%
1 gen 2001 anni
0.271
-0.046
-14.37%
1 gen 2002 anni
0.259
-0.012
-4.36%
1 gen 2003 anni
0.298
+0.039
14.93%
1 gen 2004 anni
0.269
-0.029
-9.79%
1 gen 2005 anni
0.246
-0.023
-8.68%
1 gen 2006 anni
0.244
-0.001
-0.56%
1 gen 2007 anni
0.231
-0.013
-5.25%
1 gen 2008 anni
0.207
-0.025
-10.6%
1 gen 2009 anni
0.186
-0.021
-10.22%
1 gen 2010 anni
0.415
+0.229
123.38%
1 gen 2011 anni
0.229
-0.185
-44.7%
1 gen 2012 anni
0.231
+0.002
0.76%
1 gen 2013 anni
0.236
+0.005
2.13%
1 gen 2014 anni
0.189
-0.047
-20.05%
1 gen 2015 anni
0.197
+0.009
4.54%
Classificazione dei paesi secondo i statistiche attuali per anni


Commenti: