29
/it/
it
AIzaSyAYiBZKx7MnpbEhh9jyipgxe19OcubqV5w
April 1, 2024
38358
IDA blend
IDB
false
2
1
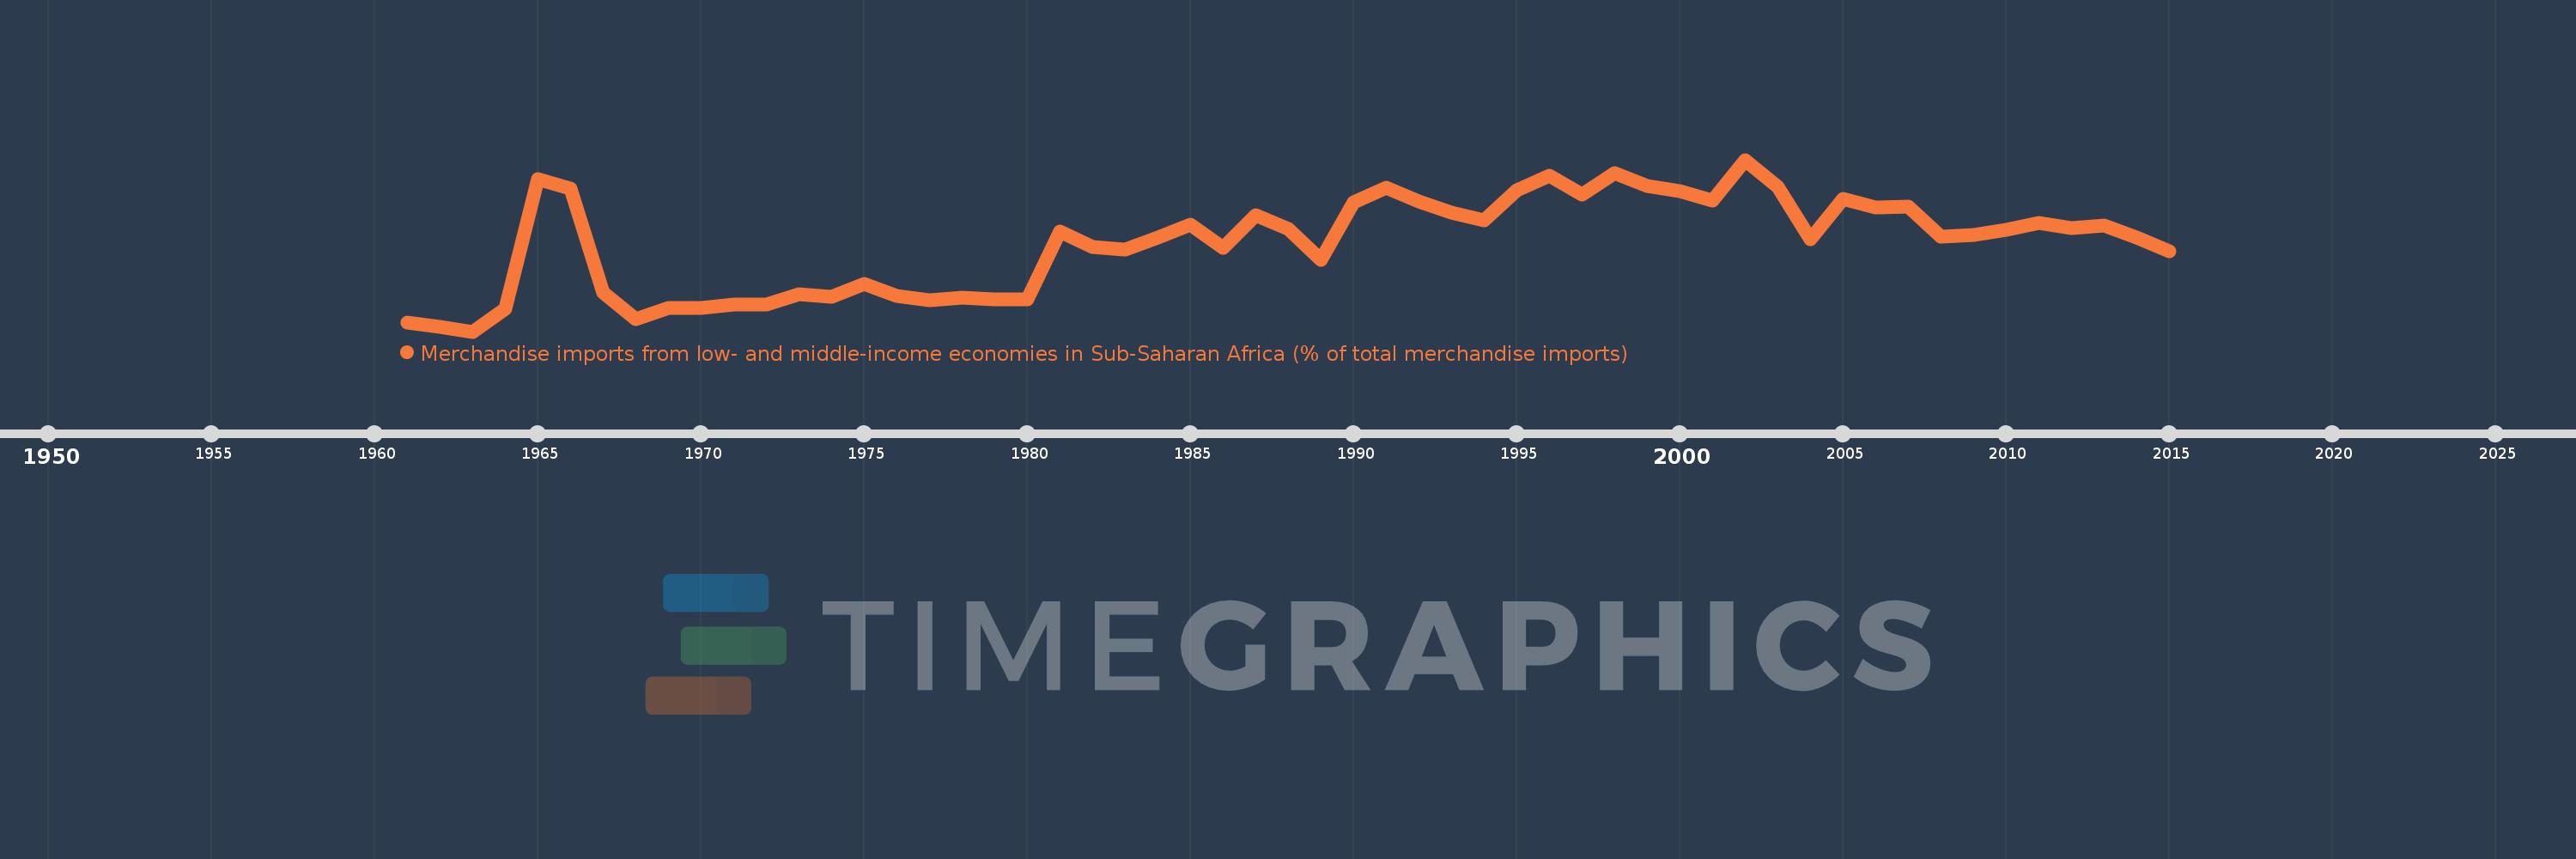
Merchandise imports from low- and middle-income economies in Sub-Saharan Africa (% of total merchandise imports)
2015,2014,2013,2012,2011,2010,2009,2008,2007,2006,2005,2004,2003,2002,2001,2000,1999,1998,1997,1996,1995,1994,1993,1992,1991,1990,1989,1988,1987,1986,1985,1984,1983,1982,1981,1980,1979,1978,1977,1976,1975,1974,1973,1972,1971,1970,1969,1968,1967,1966,1965,1964,1963,1962,1961
Queste statistiche in altri paesi:
AlbaniaAlgeriaAngolaArab WorldArgentinaArmeniaArubaAustraliaAustriaAzerbaijanBahamas, TheBahrainBangladeshBarbadosBelarusBelgiumBelizeBeninBermudaBoliviaBrazilBrunei DarussalamBulgariaBurkina FasoBurundiCabo VerdeCambodiaCameroonCanadaCaribbean small statesCentral African RepublicCentral Europe and the BalticsChadChileChinaColombiaCongo, Dem. Rep.Congo, Rep.Costa RicaCote d'IvoireCroatiaCubaCyprusCzech RepublicDenmarkDjiboutiDominicaDominican RepublicEarly-demographic dividendEast Asia & PacificEast Asia & Pacific (excluding high income)East Asia & Pacific (IDA & IBRD countries)EcuadorEgypt, Arab Rep.El SalvadorEstoniaEthiopiaEuro areaEurope & Central AsiaEurope & Central Asia (excluding high income)Europe & Central Asia (IDA & IBRD countries)European UnionFijiFinlandFragile and conflict affected situationsFranceGabonGambia, TheGeorgiaGermanyGhanaGreeceGreenlandGrenadaGuatemalaGuineaGuinea-BissauGuyanaHaitiHeavily indebted poor countries (HIPC)High incomeHondurasHong Kong SAR, ChinaHungaryIBRD onlyIcelandIDA & IBRD totalIDA blendIDA onlyIDA totalIndiaIndonesiaIran, Islamic Rep.IraqIrelandIsraelItalyJamaicaJapanJordanKazakhstanKenyaKorea, Dem. People’s Rep.Korea, Rep.KuwaitLao PDRLate-demographic dividendLatin America & Caribbean Latin America & Caribbean (excluding high income)Latin America & the Caribbean (IDA & IBRD countries)LatviaLeast developed countries: UN classificationLebanonLiberiaLibyaLithuaniaLow & middle incomeLow incomeLower middle incomeLuxembourgMacao SAR, ChinaMacedonia, FYRMadagascarMalawiMalaysiaMaliMaltaMauritaniaMauritiusMexicoMiddle East & North AfricaMiddle East & North Africa (excluding high income)Middle East & North Africa (IDA & IBRD countries)Middle incomeMoldovaMontenegroMoroccoMozambiqueMyanmarNetherlandsNew CaledoniaNew ZealandNicaraguaNigerNigeriaNorth AmericaNorwayOECD membersOmanOther small statesPacific island small statesPakistanPanamaPapua New GuineaParaguayPeruPhilippinesPolandPortugalPost-demographic dividendPre-demographic dividendQatarRomaniaRussian FederationRwandaSaudi ArabiaSenegalSerbiaSeychellesSierra LeoneSingaporeSlovak RepublicSloveniaSmall statesSomaliaSouth AfricaSouth AsiaSouth Asia (IDA & IBRD)SpainSri LankaSt. LuciaSt. Vincent and the GrenadinesSub-Saharan Africa Sub-Saharan Africa (excluding high income)Sub-Saharan Africa (IDA & IBRD countries)SudanSurinameSwedenSwitzerlandSyrian Arab RepublicTanzaniaThailandTogoTrinidad and TobagoTunisiaTurkeyUgandaUkraineUnited Arab EmiratesUnited KingdomUnited StatesUpper middle incomeUruguayVenezuela, RBVietnamWorldYemen, Rep.ZambiaZimbabwe Linea del tempo:
Questa scala temporale mostra un grafico dal 1961 anno al 2015 anno. IDA blend. I dati fino ad 1960 anno non disponibili. Il numero di osservazioni attuali secondo i date: 55.
La fonte (nome):
Indicatori dello sviluppo mondiale
La fonte (organizzazione):
World Bank staff estimates based data from International Monetary Fund's Direction of Trade database.
Categorie:
Private Sector, Trade
sono stati aggiornati
23 apr 2017 anni
Indicatori delle variazioni dei valori per anni
Minima:
0.377
1 gen 1963 anni
Massimo:
4.963
1 gen 2002 anni
Alla data di osservazione
Valore
Variazione assoluta
La variazione rispetto al valore precedente
1 gen 1961 anni
0.622
+0.622
0.0%
1 gen 1962 anni
0.495
-0.127
-20.48%
1 gen 1963 anni
0.377
-0.118
-23.83%
1 gen 1964 anni
0.982
+0.605
160.67%
1 gen 1965 anni
4.443
+3.46
352.29%
1 gen 1966 anni
4.205
-0.238
-5.36%
1 gen 1967 anni
1.422
-2.782
-66.17%
1 gen 1968 anni
0.718
-0.704
-49.49%
1 gen 1969 anni
1.019
+0.301
41.88%
1 gen 1970 anni
1.009
-0.011
-1.05%
1 gen 1971 anni
1.095
+0.086
8.55%
1 gen 1972 anni
1.099
+0.004
0.39%
1 gen 1973 anni
1.364
+0.265
24.07%
1 gen 1974 anni
1.302
-0.062
-4.56%
1 gen 1975 anni
1.66
+0.358
27.51%
1 gen 1976 anni
1.318
-0.341
-20.56%
1 gen 1977 anni
1.205
-0.114
-8.62%
1 gen 1978 anni
1.287
+0.082
6.78%
1 gen 1979 anni
1.227
-0.06
-4.66%
1 gen 1980 anni
1.236
+0.01
0.8%
1 gen 1981 anni
3.042
+1.806
146.1%
1 gen 1982 anni
2.637
-0.406
-13.33%
1 gen 1983 anni
2.574
-0.063
-2.37%
1 gen 1984 anni
2.885
+0.311
12.08%
1 gen 1985 anni
3.238
+0.353
12.24%
1 gen 1986 anni
2.609
-0.629
-19.44%
1 gen 1987 anni
3.489
+0.881
33.75%
1 gen 1988 anni
3.119
-0.37
-10.6%
1 gen 1989 anni
2.291
-0.829
-26.56%
1 gen 1990 anni
3.834
+1.544
67.38%
1 gen 1991 anni
4.227
+0.393
10.25%
1 gen 1992 anni
3.84
-0.387
-9.16%
1 gen 1993 anni
3.561
-0.279
-7.27%
1 gen 1994 anni
3.346
-0.215
-6.03%
1 gen 1995 anni
4.148
+0.802
23.96%
1 gen 1996 anni
4.542
+0.395
9.51%
1 gen 1997 anni
4.026
-0.517
-11.37%
1 gen 1998 anni
4.604
+0.578
14.36%
1 gen 1999 anni
4.261
-0.343
-7.45%
1 gen 2000 anni
4.128
-0.133
-3.11%
1 gen 2001 anni
3.881
-0.247
-5.98%
1 gen 2002 anni
4.963
+1.082
27.88%
1 gen 2003 anni
4.239
-0.724
-14.6%
1 gen 2004 anni
2.835
-1.404
-33.12%
1 gen 2005 anni
3.913
+1.078
38.02%
1 gen 2006 anni
3.687
-0.226
-5.78%
1 gen 2007 anni
3.716
+0.029
0.79%
1 gen 2008 anni
2.918
-0.798
-21.48%
1 gen 2009 anni
2.957
+0.039
1.34%
1 gen 2010 anni
3.091
+0.134
4.55%
1 gen 2011 anni
3.285
+0.194
6.27%
1 gen 2012 anni
3.142
-0.143
-4.35%
1 gen 2013 anni
3.205
+0.063
1.99%
1 gen 2014 anni
2.898
-0.307
-9.59%
1 gen 2015 anni
2.532
-0.365
-12.6%
Classificazione dei paesi secondo i statistiche attuali per anni


Commenti: