29
/it/
it
AIzaSyAYiBZKx7MnpbEhh9jyipgxe19OcubqV5w
April 1, 2024
135800
Gabon
GAB
true
2
1
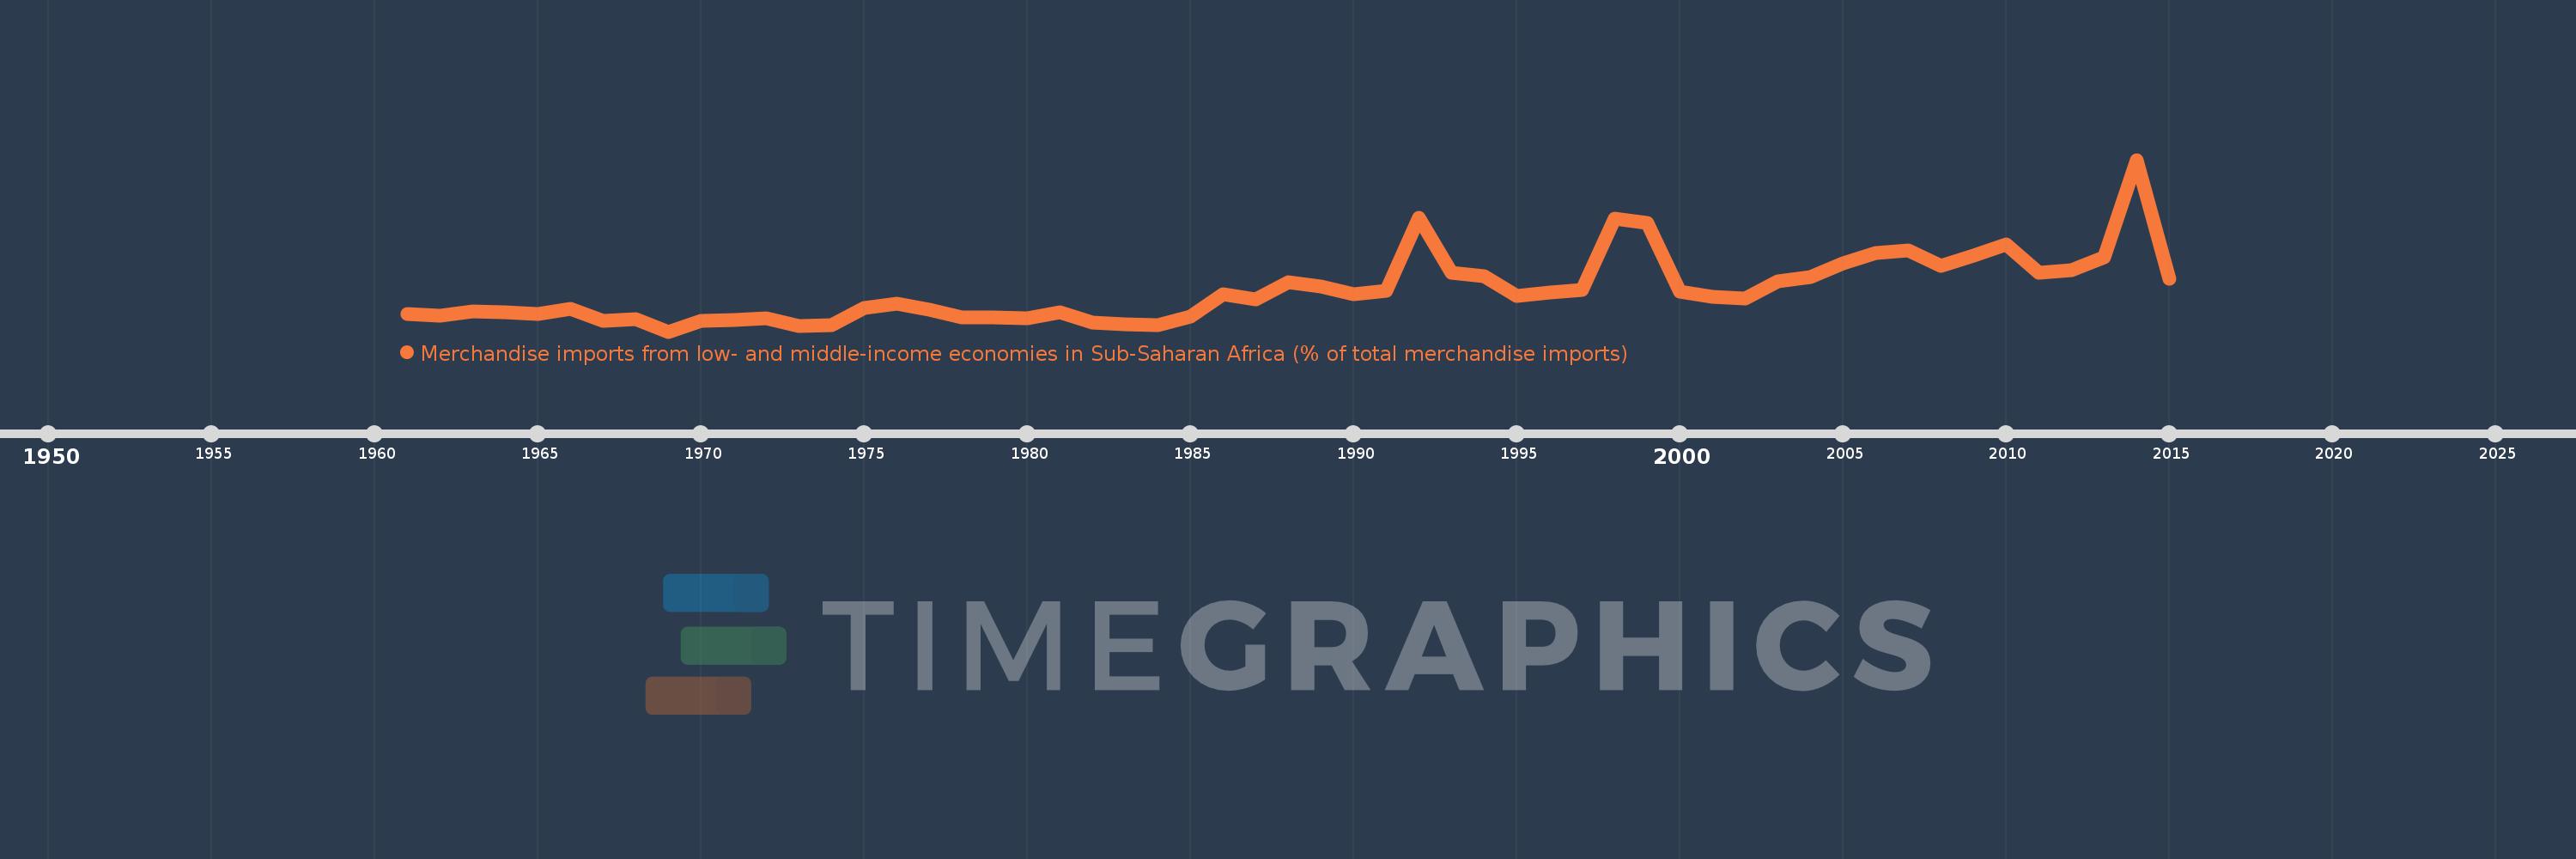
Merchandise imports from low- and middle-income economies in Sub-Saharan Africa (% of total merchandise imports)
2015,2014,2013,2012,2011,2010,2009,2008,2007,2006,2005,2004,2003,2002,2001,2000,1999,1998,1997,1996,1995,1994,1993,1992,1991,1990,1989,1988,1987,1986,1985,1984,1983,1982,1981,1980,1979,1978,1977,1976,1975,1974,1973,1972,1971,1970,1969,1968,1967,1966,1965,1964,1963,1962,1961
Queste statistiche in altri paesi:
AlbaniaAlgeriaAngolaArab WorldArgentinaArmeniaArubaAustraliaAustriaAzerbaijanBahamas, TheBahrainBangladeshBarbadosBelarusBelgiumBelizeBeninBermudaBoliviaBrazilBrunei DarussalamBulgariaBurkina FasoBurundiCabo VerdeCambodiaCameroonCanadaCaribbean small statesCentral African RepublicCentral Europe and the BalticsChadChileChinaColombiaCongo, Dem. Rep.Congo, Rep.Costa RicaCote d'IvoireCroatiaCubaCyprusCzech RepublicDenmarkDjiboutiDominicaDominican RepublicEarly-demographic dividendEast Asia & PacificEast Asia & Pacific (excluding high income)East Asia & Pacific (IDA & IBRD countries)EcuadorEgypt, Arab Rep.El SalvadorEstoniaEthiopiaEuro areaEurope & Central AsiaEurope & Central Asia (excluding high income)Europe & Central Asia (IDA & IBRD countries)European UnionFijiFinlandFragile and conflict affected situationsFranceGabonGambia, TheGeorgiaGermanyGhanaGreeceGreenlandGrenadaGuatemalaGuineaGuinea-BissauGuyanaHaitiHeavily indebted poor countries (HIPC)High incomeHondurasHong Kong SAR, ChinaHungaryIBRD onlyIcelandIDA & IBRD totalIDA blendIDA onlyIDA totalIndiaIndonesiaIran, Islamic Rep.IraqIrelandIsraelItalyJamaicaJapanJordanKazakhstanKenyaKorea, Dem. People’s Rep.Korea, Rep.KuwaitLao PDRLate-demographic dividendLatin America & Caribbean Latin America & Caribbean (excluding high income)Latin America & the Caribbean (IDA & IBRD countries)LatviaLeast developed countries: UN classificationLebanonLiberiaLibyaLithuaniaLow & middle incomeLow incomeLower middle incomeLuxembourgMacao SAR, ChinaMacedonia, FYRMadagascarMalawiMalaysiaMaliMaltaMauritaniaMauritiusMexicoMiddle East & North AfricaMiddle East & North Africa (excluding high income)Middle East & North Africa (IDA & IBRD countries)Middle incomeMoldovaMontenegroMoroccoMozambiqueMyanmarNetherlandsNew CaledoniaNew ZealandNicaraguaNigerNigeriaNorth AmericaNorwayOECD membersOmanOther small statesPacific island small statesPakistanPanamaPapua New GuineaParaguayPeruPhilippinesPolandPortugalPost-demographic dividendPre-demographic dividendQatarRomaniaRussian FederationRwandaSaudi ArabiaSenegalSerbiaSeychellesSierra LeoneSingaporeSlovak RepublicSloveniaSmall statesSomaliaSouth AfricaSouth AsiaSouth Asia (IDA & IBRD)SpainSri LankaSt. LuciaSt. Vincent and the GrenadinesSub-Saharan Africa Sub-Saharan Africa (excluding high income)Sub-Saharan Africa (IDA & IBRD countries)SudanSurinameSwedenSwitzerlandSyrian Arab RepublicTanzaniaThailandTogoTrinidad and TobagoTunisiaTurkeyUgandaUkraineUnited Arab EmiratesUnited KingdomUnited StatesUpper middle incomeUruguayVenezuela, RBVietnamWorldYemen, Rep.ZambiaZimbabwe Linea del tempo:
Questa scala temporale mostra un grafico dal 1961 anno al 2015 anno. Gabon. I dati fino ad 1960 anno non disponibili. Il numero di osservazioni attuali secondo i date: 55.
La fonte (nome):
Indicatori dello sviluppo mondiale
La fonte (organizzazione):
World Bank staff estimates based data from International Monetary Fund's Direction of Trade database.
Categorie:
Private Sector, Trade
sono stati aggiornati
23 apr 2017 anni
Indicatori delle variazioni dei valori per anni
Minima:
0.0
1 gen 1969 anni
Massimo:
24.201
1 gen 2014 anni
Alla data di osservazione
Valore
Variazione assoluta
La variazione rispetto al valore precedente
1 gen 1961 anni
2.516
+2.516
0.0%
1 gen 1962 anni
2.235
-0.281
-11.17%
1 gen 1963 anni
2.835
+0.6
26.87%
1 gen 1964 anni
2.703
-0.132
-4.67%
1 gen 1965 anni
2.523
-0.18
-6.67%
1 gen 1966 anni
3.21
+0.688
27.26%
1 gen 1967 anni
1.506
-1.704
-53.09%
1 gen 1968 anni
1.778
+0.272
18.04%
1 gen 1969 anni
0.0
-1.778
-100.0%
1 gen 1970 anni
1.565
+1.565
%
1 gen 1971 anni
1.642
+0.077
4.92%
1 gen 1972 anni
1.875
+0.234
14.24%
1 gen 1973 anni
0.761
-1.114
-59.41%
1 gen 1974 anni
0.906
+0.145
19.07%
1 gen 1975 anni
3.345
+2.439
269.11%
1 gen 1976 anni
3.96
+0.615
18.38%
1 gen 1977 anni
3.129
-0.831
-20.98%
1 gen 1978 anni
1.997
-1.132
-36.18%
1 gen 1979 anni
1.957
-0.04
-2.0%
1 gen 1980 anni
1.847
-0.11
-5.62%
1 gen 1981 anni
2.777
+0.93
50.36%
1 gen 1982 anni
1.232
-1.545
-55.63%
1 gen 1983 anni
1.027
-0.205
-16.65%
1 gen 1984 anni
0.931
-0.096
-9.33%
1 gen 1985 anni
2.124
+1.192
128.06%
1 gen 1986 anni
5.264
+3.141
147.91%
1 gen 1987 anni
4.54
-0.725
-13.77%
1 gen 1988 anni
6.921
+2.381
52.46%
1 gen 1989 anni
6.363
-0.558
-8.06%
1 gen 1990 anni
5.309
-1.054
-16.56%
1 gen 1991 anni
5.773
+0.464
8.73%
1 gen 1992 anni
15.98
+10.208
176.83%
1 gen 1993 anni
8.301
-7.679
-48.05%
1 gen 1994 anni
7.826
-0.476
-5.73%
1 gen 1995 anni
5.036
-2.79
-35.65%
1 gen 1996 anni
5.566
+0.53
10.52%
1 gen 1997 anni
5.886
+0.32
5.76%
1 gen 1998 anni
15.907
+10.022
170.26%
1 gen 1999 anni
15.314
-0.593
-3.73%
1 gen 2000 anni
5.65
-9.665
-63.11%
1 gen 2001 anni
4.843
-0.806
-14.27%
1 gen 2002 anni
4.691
-0.153
-3.15%
1 gen 2003 anni
7.077
+2.386
50.87%
1 gen 2004 anni
7.732
+0.655
9.26%
1 gen 2005 anni
9.631
+1.9
24.57%
1 gen 2006 anni
11.062
+1.43
14.85%
1 gen 2007 anni
11.422
+0.36
3.25%
1 gen 2008 anni
9.202
-2.22
-19.43%
1 gen 2009 anni
10.651
+1.449
15.75%
1 gen 2010 anni
12.257
+1.605
15.07%
1 gen 2011 anni
8.301
-3.956
-32.28%
1 gen 2012 anni
8.651
+0.35
4.22%
1 gen 2013 anni
10.46
+1.809
20.91%
1 gen 2014 anni
24.201
+13.742
131.38%
1 gen 2015 anni
7.452
-16.749
-69.21%
Classificazione dei paesi secondo i statistiche attuali per anni


Commenti: