29
/it/
it
AIzaSyAYiBZKx7MnpbEhh9jyipgxe19OcubqV5w
April 1, 2024
252135
St. Vincent and the Grenadines
VCT
true
2
1
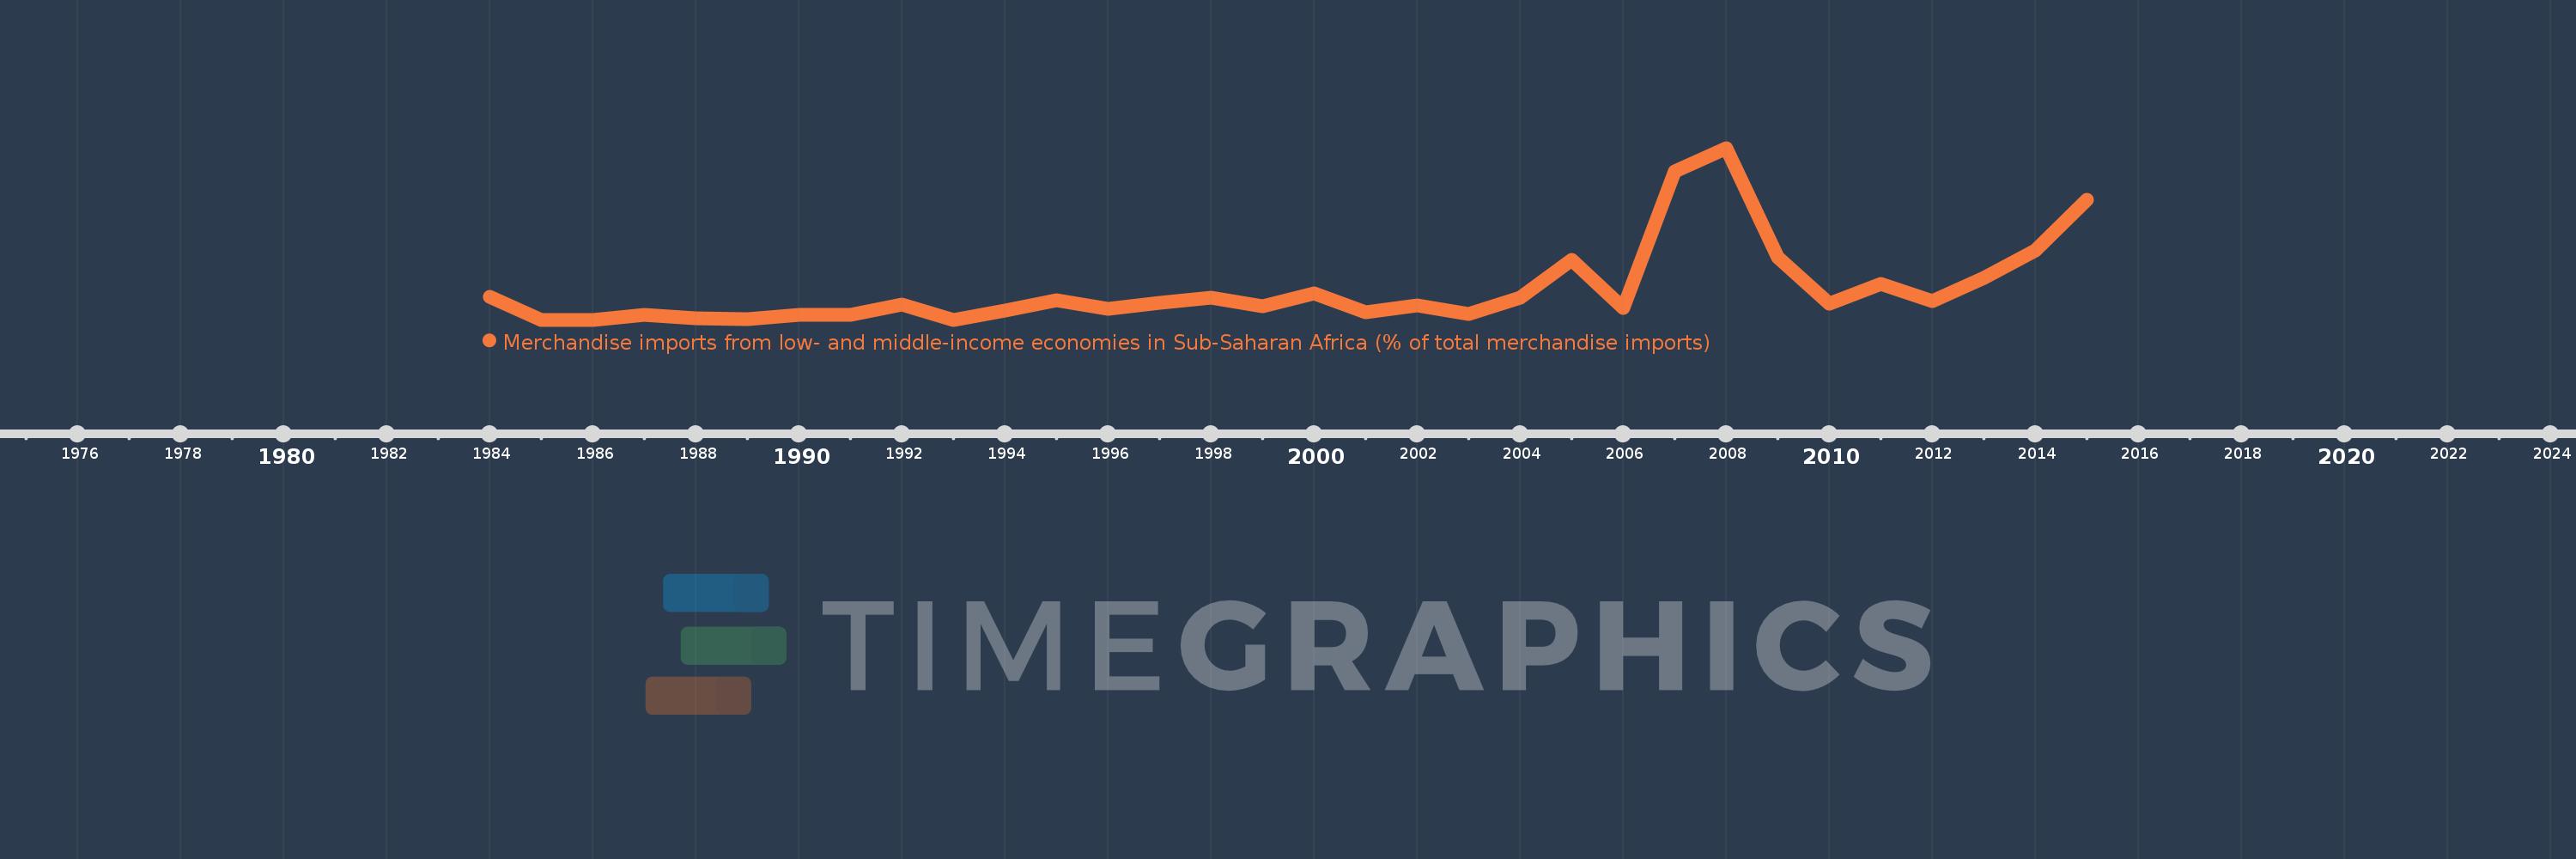
Merchandise imports from low- and middle-income economies in Sub-Saharan Africa (% of total merchandise imports)
2015,2014,2013,2012,2011,2010,2009,2008,2007,2006,2005,2004,2003,2002,2001,2000,1999,1998,1997,1996,1995,1994,1993,1992,1991,1990,1989,1988,1987,1986,1985,1984
Queste statistiche in altri paesi:
AlbaniaAlgeriaAngolaArab WorldArgentinaArmeniaArubaAustraliaAustriaAzerbaijanBahamas, TheBahrainBangladeshBarbadosBelarusBelgiumBelizeBeninBermudaBoliviaBrazilBrunei DarussalamBulgariaBurkina FasoBurundiCabo VerdeCambodiaCameroonCanadaCaribbean small statesCentral African RepublicCentral Europe and the BalticsChadChileChinaColombiaCongo, Dem. Rep.Congo, Rep.Costa RicaCote d'IvoireCroatiaCubaCyprusCzech RepublicDenmarkDjiboutiDominicaDominican RepublicEarly-demographic dividendEast Asia & PacificEast Asia & Pacific (excluding high income)East Asia & Pacific (IDA & IBRD countries)EcuadorEgypt, Arab Rep.El SalvadorEstoniaEthiopiaEuro areaEurope & Central AsiaEurope & Central Asia (excluding high income)Europe & Central Asia (IDA & IBRD countries)European UnionFijiFinlandFragile and conflict affected situationsFranceGabonGambia, TheGeorgiaGermanyGhanaGreeceGreenlandGrenadaGuatemalaGuineaGuinea-BissauGuyanaHaitiHeavily indebted poor countries (HIPC)High incomeHondurasHong Kong SAR, ChinaHungaryIBRD onlyIcelandIDA & IBRD totalIDA blendIDA onlyIDA totalIndiaIndonesiaIran, Islamic Rep.IraqIrelandIsraelItalyJamaicaJapanJordanKazakhstanKenyaKorea, Dem. People’s Rep.Korea, Rep.KuwaitLao PDRLate-demographic dividendLatin America & Caribbean Latin America & Caribbean (excluding high income)Latin America & the Caribbean (IDA & IBRD countries)LatviaLeast developed countries: UN classificationLebanonLiberiaLibyaLithuaniaLow & middle incomeLow incomeLower middle incomeLuxembourgMacao SAR, ChinaMacedonia, FYRMadagascarMalawiMalaysiaMaliMaltaMauritaniaMauritiusMexicoMiddle East & North AfricaMiddle East & North Africa (excluding high income)Middle East & North Africa (IDA & IBRD countries)Middle incomeMoldovaMontenegroMoroccoMozambiqueMyanmarNetherlandsNew CaledoniaNew ZealandNicaraguaNigerNigeriaNorth AmericaNorwayOECD membersOmanOther small statesPacific island small statesPakistanPanamaPapua New GuineaParaguayPeruPhilippinesPolandPortugalPost-demographic dividendPre-demographic dividendQatarRomaniaRussian FederationRwandaSaudi ArabiaSenegalSerbiaSeychellesSierra LeoneSingaporeSlovak RepublicSloveniaSmall statesSomaliaSouth AfricaSouth AsiaSouth Asia (IDA & IBRD)SpainSri LankaSt. LuciaSt. Vincent and the GrenadinesSub-Saharan Africa Sub-Saharan Africa (excluding high income)Sub-Saharan Africa (IDA & IBRD countries)SudanSurinameSwedenSwitzerlandSyrian Arab RepublicTanzaniaThailandTogoTrinidad and TobagoTunisiaTurkeyUgandaUkraineUnited Arab EmiratesUnited KingdomUnited StatesUpper middle incomeUruguayVenezuela, RBVietnamWorldYemen, Rep.ZambiaZimbabwe Linea del tempo:
Questa scala temporale mostra un grafico dal 1984 anno al 2015 anno. St. Vincent and the Grenadines. I dati fino ad 1983 anno non disponibili. Il numero di osservazioni attuali secondo i date: 32.
La fonte (nome):
Indicatori dello sviluppo mondiale
La fonte (organizzazione):
World Bank staff estimates based data from International Monetary Fund's Direction of Trade database.
Categorie:
Private Sector, Trade
sono stati aggiornati
23 apr 2017 anni
Indicatori delle variazioni dei valori per anni
Minima:
0.0
1 gen 1985 anni
Massimo:
0.833
1 gen 2008 anni
Alla data di osservazione
Valore
Variazione assoluta
La variazione rispetto al valore precedente
1 gen 1984 anni
0.11
+0.11
0.0%
1 gen 1985 anni
0.0
-0.11
-100.0%
1 gen 1987 anni
0.024
+0.024
%
1 gen 1988 anni
0.006
-0.017
-72.95%
1 gen 1989 anni
0.002
-0.005
-72.18%
1 gen 1990 anni
0.025
+0.023
1.3 Mille.%
1 gen 1991 anni
0.022
-0.003
-13.16%
1 gen 1992 anni
0.072
+0.05
230.92%
1 gen 1993 anni
0.0
-0.072
-100.0%
1 gen 1994 anni
0.045
+0.045
%
1 gen 1995 anni
0.093
+0.048
106.9%
1 gen 1996 anni
0.054
-0.039
-42.15%
1 gen 1997 anni
0.082
+0.028
52.36%
1 gen 1998 anni
0.106
+0.024
29.17%
1 gen 1999 anni
0.067
-0.038
-36.23%
1 gen 2000 anni
0.127
+0.059
87.98%
1 gen 2001 anni
0.038
-0.088
-69.83%
1 gen 2002 anni
0.071
+0.033
85.74%
1 gen 2003 anni
0.029
-0.042
-59.17%
1 gen 2004 anni
0.108
+0.079
273.88%
1 gen 2005 anni
0.291
+0.183
168.9%
1 gen 2006 anni
0.058
-0.234
-80.22%
1 gen 2007 anni
0.721
+0.663
1.15 Mille.%
1 gen 2008 anni
0.833
+0.113
15.63%
1 gen 2009 anni
0.303
-0.531
-63.65%
1 gen 2010 anni
0.079
-0.224
-73.85%
1 gen 2011 anni
0.173
+0.093
117.92%
1 gen 2012 anni
0.092
-0.08
-46.55%
1 gen 2013 anni
0.201
+0.109
118.15%
1 gen 2014 anni
0.337
+0.136
67.44%
1 gen 2015 anni
0.582
+0.245
72.81%
Classificazione dei paesi secondo i statistiche attuali per anni


Commenti: