29
/it/
it
AIzaSyAYiBZKx7MnpbEhh9jyipgxe19OcubqV5w
April 1, 2024
107555
Colombia
COL
true
2
1
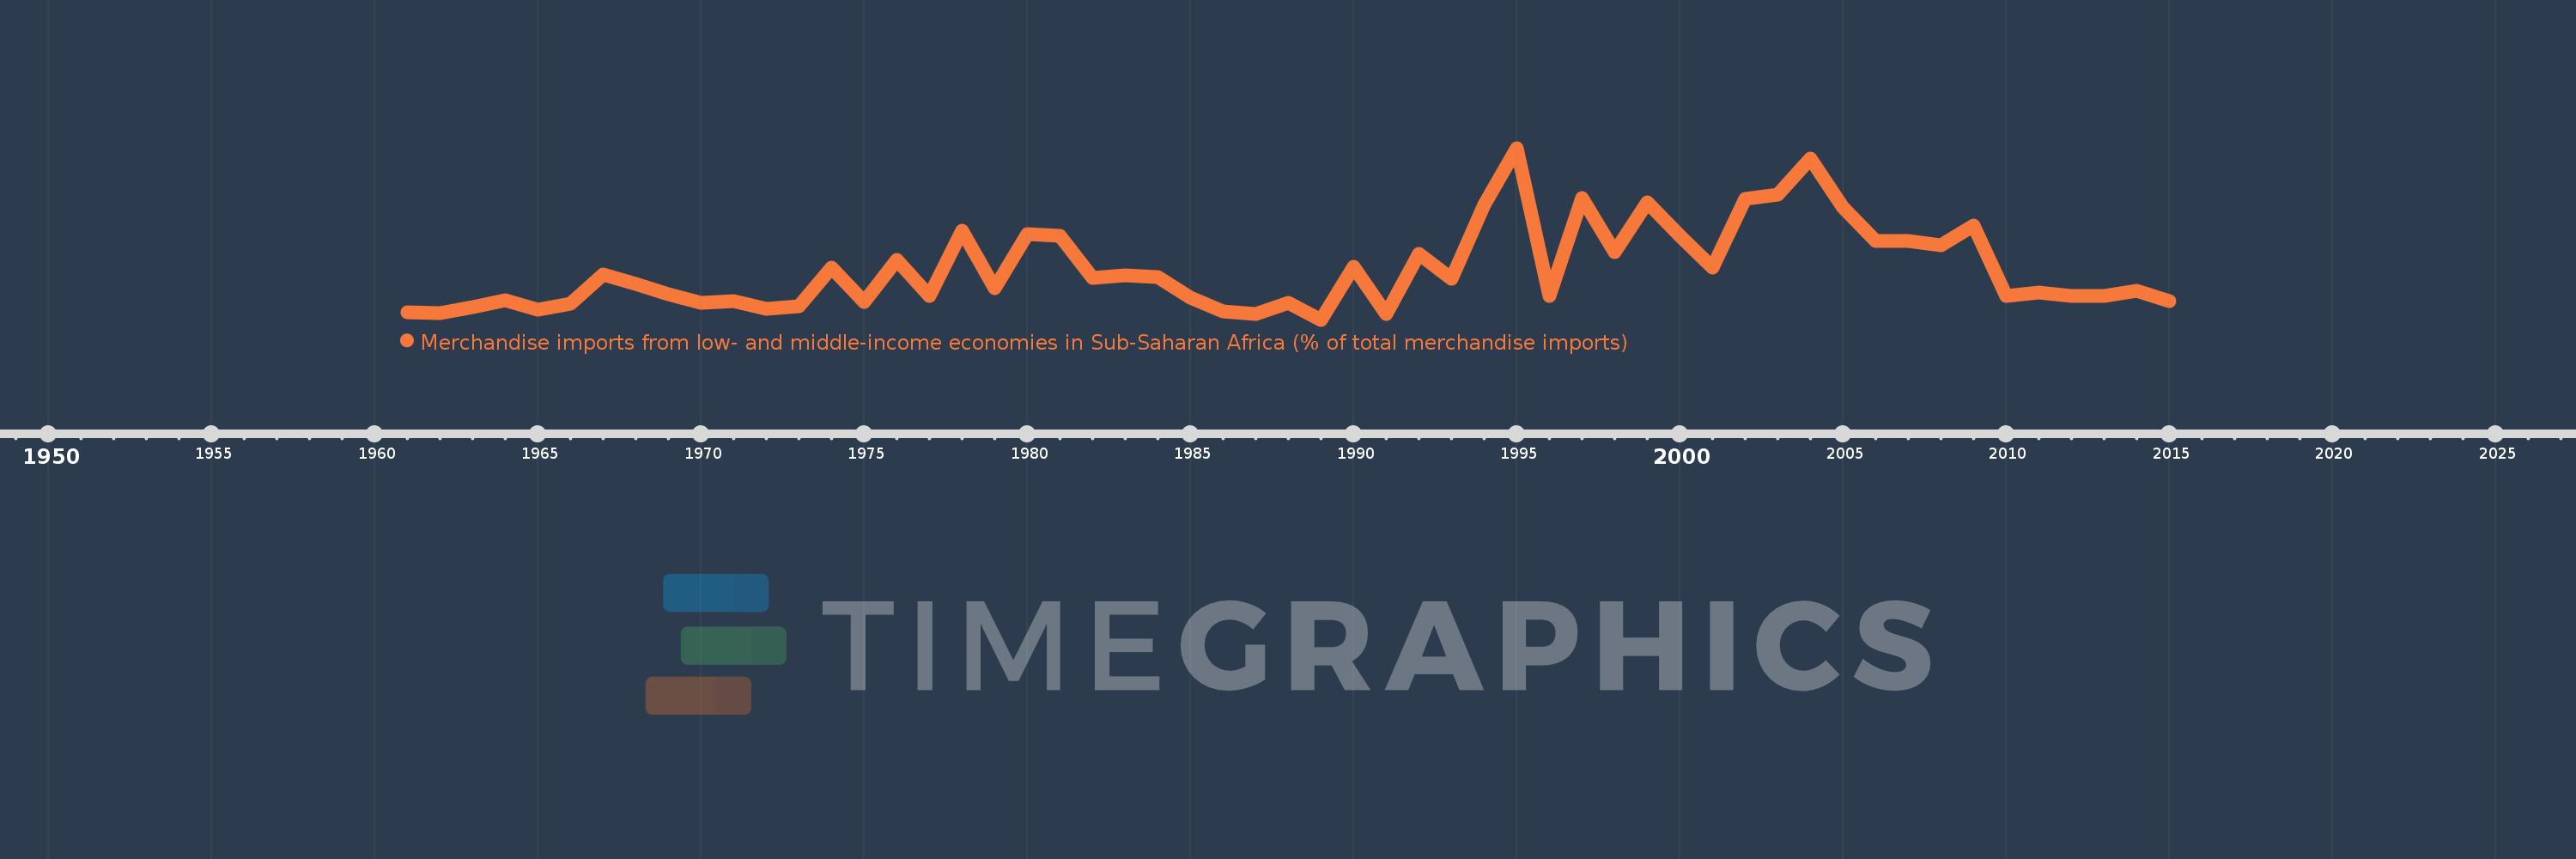
Merchandise imports from low- and middle-income economies in Sub-Saharan Africa (% of total merchandise imports)
2015,2014,2013,2012,2011,2010,2009,2008,2007,2006,2005,2004,2003,2002,2001,2000,1999,1998,1997,1996,1995,1994,1993,1992,1991,1990,1989,1988,1987,1986,1985,1984,1983,1982,1981,1980,1979,1978,1977,1976,1975,1974,1973,1972,1971,1970,1969,1968,1967,1966,1965,1964,1963,1962,1961
Queste statistiche in altri paesi:
AlbaniaAlgeriaAngolaArab WorldArgentinaArmeniaArubaAustraliaAustriaAzerbaijanBahamas, TheBahrainBangladeshBarbadosBelarusBelgiumBelizeBeninBermudaBoliviaBrazilBrunei DarussalamBulgariaBurkina FasoBurundiCabo VerdeCambodiaCameroonCanadaCaribbean small statesCentral African RepublicCentral Europe and the BalticsChadChileChinaColombiaCongo, Dem. Rep.Congo, Rep.Costa RicaCote d'IvoireCroatiaCubaCyprusCzech RepublicDenmarkDjiboutiDominicaDominican RepublicEarly-demographic dividendEast Asia & PacificEast Asia & Pacific (excluding high income)East Asia & Pacific (IDA & IBRD countries)EcuadorEgypt, Arab Rep.El SalvadorEstoniaEthiopiaEuro areaEurope & Central AsiaEurope & Central Asia (excluding high income)Europe & Central Asia (IDA & IBRD countries)European UnionFijiFinlandFragile and conflict affected situationsFranceGabonGambia, TheGeorgiaGermanyGhanaGreeceGreenlandGrenadaGuatemalaGuineaGuinea-BissauGuyanaHaitiHeavily indebted poor countries (HIPC)High incomeHondurasHong Kong SAR, ChinaHungaryIBRD onlyIcelandIDA & IBRD totalIDA blendIDA onlyIDA totalIndiaIndonesiaIran, Islamic Rep.IraqIrelandIsraelItalyJamaicaJapanJordanKazakhstanKenyaKorea, Dem. People’s Rep.Korea, Rep.KuwaitLao PDRLate-demographic dividendLatin America & Caribbean Latin America & Caribbean (excluding high income)Latin America & the Caribbean (IDA & IBRD countries)LatviaLeast developed countries: UN classificationLebanonLiberiaLibyaLithuaniaLow & middle incomeLow incomeLower middle incomeLuxembourgMacao SAR, ChinaMacedonia, FYRMadagascarMalawiMalaysiaMaliMaltaMauritaniaMauritiusMexicoMiddle East & North AfricaMiddle East & North Africa (excluding high income)Middle East & North Africa (IDA & IBRD countries)Middle incomeMoldovaMontenegroMoroccoMozambiqueMyanmarNetherlandsNew CaledoniaNew ZealandNicaraguaNigerNigeriaNorth AmericaNorwayOECD membersOmanOther small statesPacific island small statesPakistanPanamaPapua New GuineaParaguayPeruPhilippinesPolandPortugalPost-demographic dividendPre-demographic dividendQatarRomaniaRussian FederationRwandaSaudi ArabiaSenegalSerbiaSeychellesSierra LeoneSingaporeSlovak RepublicSloveniaSmall statesSomaliaSouth AfricaSouth AsiaSouth Asia (IDA & IBRD)SpainSri LankaSt. LuciaSt. Vincent and the GrenadinesSub-Saharan Africa Sub-Saharan Africa (excluding high income)Sub-Saharan Africa (IDA & IBRD countries)SudanSurinameSwedenSwitzerlandSyrian Arab RepublicTanzaniaThailandTogoTrinidad and TobagoTunisiaTurkeyUgandaUkraineUnited Arab EmiratesUnited KingdomUnited StatesUpper middle incomeUruguayVenezuela, RBVietnamWorldYemen, Rep.ZambiaZimbabwe Linea del tempo:
Questa scala temporale mostra un grafico dal 1961 anno al 2015 anno. Colombia. I dati fino ad 1960 anno non disponibili. Il numero di osservazioni attuali secondo i date: 55.
La fonte (nome):
Indicatori dello sviluppo mondiale
La fonte (organizzazione):
World Bank staff estimates based data from International Monetary Fund's Direction of Trade database.
Categorie:
Private Sector, Trade
sono stati aggiornati
23 apr 2017 anni
Indicatori delle variazioni dei valori per anni
Minima:
0.031
1 gen 1989 anni
Massimo:
0.648
1 gen 1995 anni
Alla data di osservazione
Valore
Variazione assoluta
La variazione rispetto al valore precedente
1 gen 1961 anni
0.058
+0.058
0.0%
1 gen 1962 anni
0.056
-0.003
-4.68%
1 gen 1963 anni
0.075
+0.019
33.98%
1 gen 1964 anni
0.1
+0.025
33.84%
1 gen 1965 anni
0.068
-0.032
-31.58%
1 gen 1966 anni
0.088
+0.02
29.46%
1 gen 1967 anni
0.193
+0.104
117.87%
1 gen 1968 anni
0.161
-0.032
-16.43%
1 gen 1969 anni
0.123
-0.038
-23.9%
1 gen 1970 anni
0.092
-0.031
-25.04%
1 gen 1971 anni
0.097
+0.005
5.71%
1 gen 1972 anni
0.07
-0.027
-28.02%
1 gen 1973 anni
0.08
+0.01
14.87%
1 gen 1974 anni
0.217
+0.137
170.69%
1 gen 1975 anni
0.096
-0.122
-55.95%
1 gen 1976 anni
0.245
+0.149
155.61%
1 gen 1977 anni
0.115
-0.13
-53.13%
1 gen 1978 anni
0.352
+0.237
206.39%
1 gen 1979 anni
0.145
-0.207
-58.89%
1 gen 1980 anni
0.338
+0.194
133.86%
1 gen 1981 anni
0.332
-0.006
-1.73%
1 gen 1982 anni
0.181
-0.151
-45.52%
1 gen 1983 anni
0.191
+0.01
5.31%
1 gen 1984 anni
0.184
-0.006
-3.26%
1 gen 1985 anni
0.111
-0.073
-39.64%
1 gen 1986 anni
0.061
-0.05
-44.97%
1 gen 1987 anni
0.052
-0.009
-14.43%
1 gen 1988 anni
0.091
+0.038
72.87%
1 gen 1989 anni
0.031
-0.059
-65.59%
1 gen 1990 anni
0.221
+0.189
607.8%
1 gen 1991 anni
0.053
-0.168
-76.17%
1 gen 1992 anni
0.269
+0.217
411.94%
1 gen 1993 anni
0.177
-0.092
-34.13%
1 gen 1994 anni
0.445
+0.267
150.74%
1 gen 1995 anni
0.648
+0.203
45.68%
1 gen 1996 anni
0.117
-0.53
-81.86%
1 gen 1997 anni
0.469
+0.351
298.94%
1 gen 1998 anni
0.275
-0.194
-41.43%
1 gen 1999 anni
0.453
+0.178
64.86%
1 gen 2000 anni
0.332
-0.12
-26.55%
1 gen 2001 anni
0.217
-0.115
-34.71%
1 gen 2002 anni
0.466
+0.249
114.55%
1 gen 2003 anni
0.48
+0.014
2.97%
1 gen 2004 anni
0.609
+0.129
26.97%
1 gen 2005 anni
0.434
-0.175
-28.72%
1 gen 2006 anni
0.313
-0.121
-27.98%
1 gen 2007 anni
0.314
+0.001
0.45%
1 gen 2008 anni
0.3
-0.014
-4.31%
1 gen 2009 anni
0.368
+0.068
22.56%
1 gen 2010 anni
0.115
-0.254
-68.87%
1 gen 2011 anni
0.13
+0.016
13.78%
1 gen 2012 anni
0.116
-0.015
-11.32%
1 gen 2013 anni
0.115
-0.001
-0.83%
1 gen 2014 anni
0.135
+0.02
17.66%
1 gen 2015 anni
0.099
-0.036
-26.99%
Classificazione dei paesi secondo i statistiche attuali per anni


Commenti: