29
/it/
it
AIzaSyAYiBZKx7MnpbEhh9jyipgxe19OcubqV5w
April 1, 2024
78149
Bangladesh
BGD
true
2
1
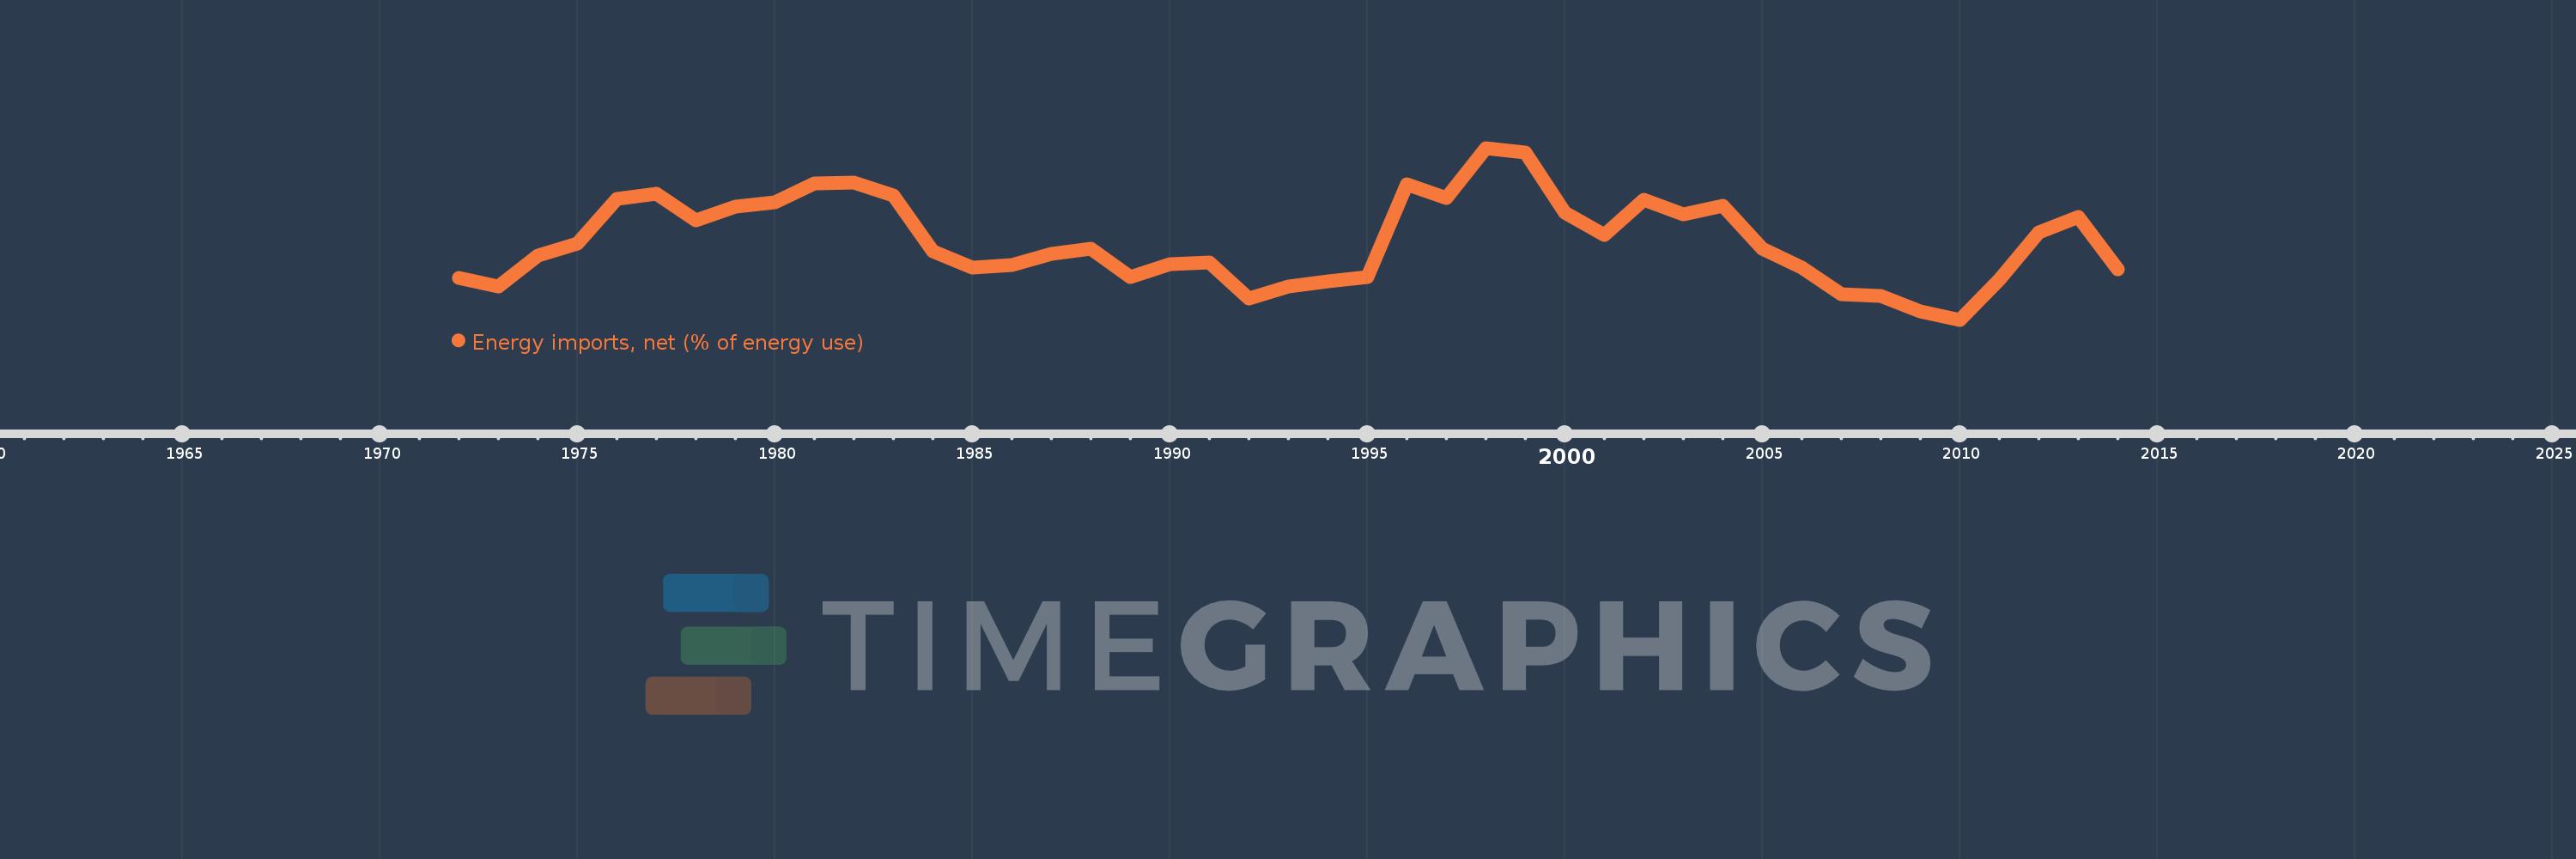
Energy imports, net (% of energy use)
2014,2013,2012,2011,2010,2009,2008,2007,2006,2005,2004,2003,2002,2001,2000,1999,1998,1997,1996,1995,1994,1993,1992,1991,1990,1989,1988,1987,1986,1985,1984,1983,1982,1981,1980,1979,1978,1977,1976,1975,1974,1973,1972
Queste statistiche in altri paesi:
AlbaniaAlgeriaAngolaArab WorldArgentinaArmeniaAustraliaAustriaAzerbaijanBahrainBangladeshBelarusBelgiumBeninBoliviaBosnia and HerzegovinaBotswanaBrazilBrunei DarussalamBulgariaCambodiaCameroonCanadaCaribbean small statesCentral Europe and the BalticsChileChinaColombiaCongo, Dem. Rep.Congo, Rep.Costa RicaCote d'IvoireCroatiaCubaCuracaoCyprusCzech RepublicDenmarkDominican RepublicEarly-demographic dividendEast Asia & PacificEast Asia & Pacific (excluding high income)East Asia & Pacific (IDA & IBRD countries)EcuadorEgypt, Arab Rep.El SalvadorEritreaEstoniaEthiopiaEuro areaEurope & Central AsiaEurope & Central Asia (excluding high income)Europe & Central Asia (IDA & IBRD countries)European UnionFinlandFragile and conflict affected situationsFranceGabonGeorgiaGermanyGhanaGibraltarGreeceGuatemalaHaitiHeavily indebted poor countries (HIPC)High incomeHondurasHong Kong SAR, ChinaHungaryIBRD onlyIcelandIDA & IBRD totalIDA blendIDA onlyIDA totalIndiaIndonesiaIran, Islamic Rep.IraqIrelandIsraelItalyJamaicaJapanJordanKazakhstanKenyaKorea, Dem. People’s Rep.Korea, Rep.KosovoKuwaitKyrgyz RepublicLate-demographic dividendLatin America & Caribbean Latin America & Caribbean (excluding high income)Latin America & the Caribbean (IDA & IBRD countries)LatviaLeast developed countries: UN classificationLebanonLibyaLithuaniaLow & middle incomeLow incomeLower middle incomeLuxembourgMacedonia, FYRMalaysiaMaltaMauritiusMexicoMiddle East & North AfricaMiddle East & North Africa (excluding high income)Middle East & North Africa (IDA & IBRD countries)Middle incomeMoldovaMongoliaMontenegroMoroccoMozambiqueMyanmarNamibiaNepalNetherlandsNew ZealandNicaraguaNigerNigeriaNorth AmericaNorwayOECD membersOmanOther small statesPakistanPanamaParaguayPeruPhilippinesPolandPortugalPost-demographic dividendPre-demographic dividendQatarRomaniaRussian FederationSaudi ArabiaSenegalSerbiaSingaporeSlovak RepublicSloveniaSmall statesSouth AfricaSouth AsiaSouth Asia (IDA & IBRD)South SudanSpainSri LankaSub-Saharan Africa Sub-Saharan Africa (excluding high income)Sub-Saharan Africa (IDA & IBRD countries)SudanSwedenSwitzerlandSyrian Arab RepublicTajikistanTanzaniaThailandTogoTrinidad and TobagoTunisiaTurkeyTurkmenistanUkraineUnited Arab EmiratesUnited KingdomUnited StatesUpper middle incomeUruguayUzbekistanVenezuela, RBVietnamWorldYemen, Rep.ZambiaZimbabwe Linea del tempo:
Questa scala temporale mostra un grafico dal 1972 anno al 2014 anno. Bangladesh. I dati fino ad 1971 anno non disponibili. Il numero di osservazioni attuali secondo i date: 43.
La fonte (nome):
Indicatori dello sviluppo mondiale
La fonte (organizzazione):
IEA Statistics © OECD/IEA 2014 (http://www.iea.org/stats/index.asp), subject to https://www.iea.org/t&c/termsandconditions/
Categorie:
Energy & Mining, Trade
sono stati aggiornati
23 apr 2017 anni
Indicatori delle variazioni dei valori per anni
Minima:
12.502
1 gen 2010 anni
Massimo:
21.595
1 gen 1998 anni
Alla data di osservazione
Valore
Variazione assoluta
La variazione rispetto al valore precedente
1 gen 1972 anni
14.729
+14.729
0.0%
1 gen 1973 anni
14.268
-0.462
-3.13%
1 gen 1974 anni
15.905
+1.637
11.47%
1 gen 1975 anni
16.555
+0.65
4.09%
1 gen 1976 anni
18.91
+2.355
14.23%
1 gen 1977 anni
19.171
+0.261
1.38%
1 gen 1978 anni
17.773
-1.398
-7.29%
1 gen 1979 anni
18.499
+0.726
4.08%
1 gen 1980 anni
18.697
+0.198
1.07%
1 gen 1981 anni
19.725
+1.028
5.5%
1 gen 1982 anni
19.779
+0.054
0.28%
1 gen 1983 anni
19.064
-0.715
-3.61%
1 gen 1984 anni
16.113
-2.951
-15.48%
1 gen 1985 anni
15.265
-0.848
-5.26%
1 gen 1986 anni
15.405
+0.141
0.92%
1 gen 1987 anni
15.984
+0.578
3.75%
1 gen 1988 anni
16.28
+0.297
1.86%
1 gen 1989 anni
14.761
-1.52
-9.33%
1 gen 1990 anni
15.463
+0.702
4.75%
1 gen 1991 anni
15.529
+0.067
0.43%
1 gen 1992 anni
13.606
-1.923
-12.39%
1 gen 1993 anni
14.24
+0.634
4.66%
1 gen 1994 anni
14.554
+0.314
2.21%
1 gen 1995 anni
14.777
+0.223
1.53%
1 gen 1996 anni
19.655
+4.878
33.01%
1 gen 1997 anni
18.954
-0.701
-3.57%
1 gen 1998 anni
21.595
+2.64
13.93%
1 gen 1999 anni
21.336
-0.258
-1.2%
1 gen 2000 anni
18.186
-3.151
-14.77%
1 gen 2001 anni
17.011
-1.175
-6.46%
1 gen 2002 anni
18.833
+1.823
10.71%
1 gen 2003 anni
18.089
-0.744
-3.95%
1 gen 2004 anni
18.535
+0.446
2.47%
1 gen 2005 anni
16.282
-2.253
-12.16%
1 gen 2006 anni
15.239
-1.043
-6.4%
1 gen 2007 anni
13.833
-1.406
-9.23%
1 gen 2008 anni
13.744
-0.089
-0.65%
1 gen 2009 anni
12.925
-0.819
-5.96%
1 gen 2010 anni
12.502
-0.423
-3.27%
1 gen 2011 anni
14.636
+2.134
17.07%
1 gen 2012 anni
17.144
+2.508
17.13%
1 gen 2013 anni
17.943
+0.799
4.66%
1 gen 2014 anni
15.184
-2.759
-15.37%
Classificazione dei paesi secondo i statistiche attuali per anni


Commenti: