29
/it/
it
AIzaSyAYiBZKx7MnpbEhh9jyipgxe19OcubqV5w
April 1, 2024
171628
Kuwait
KWT
true
2
1
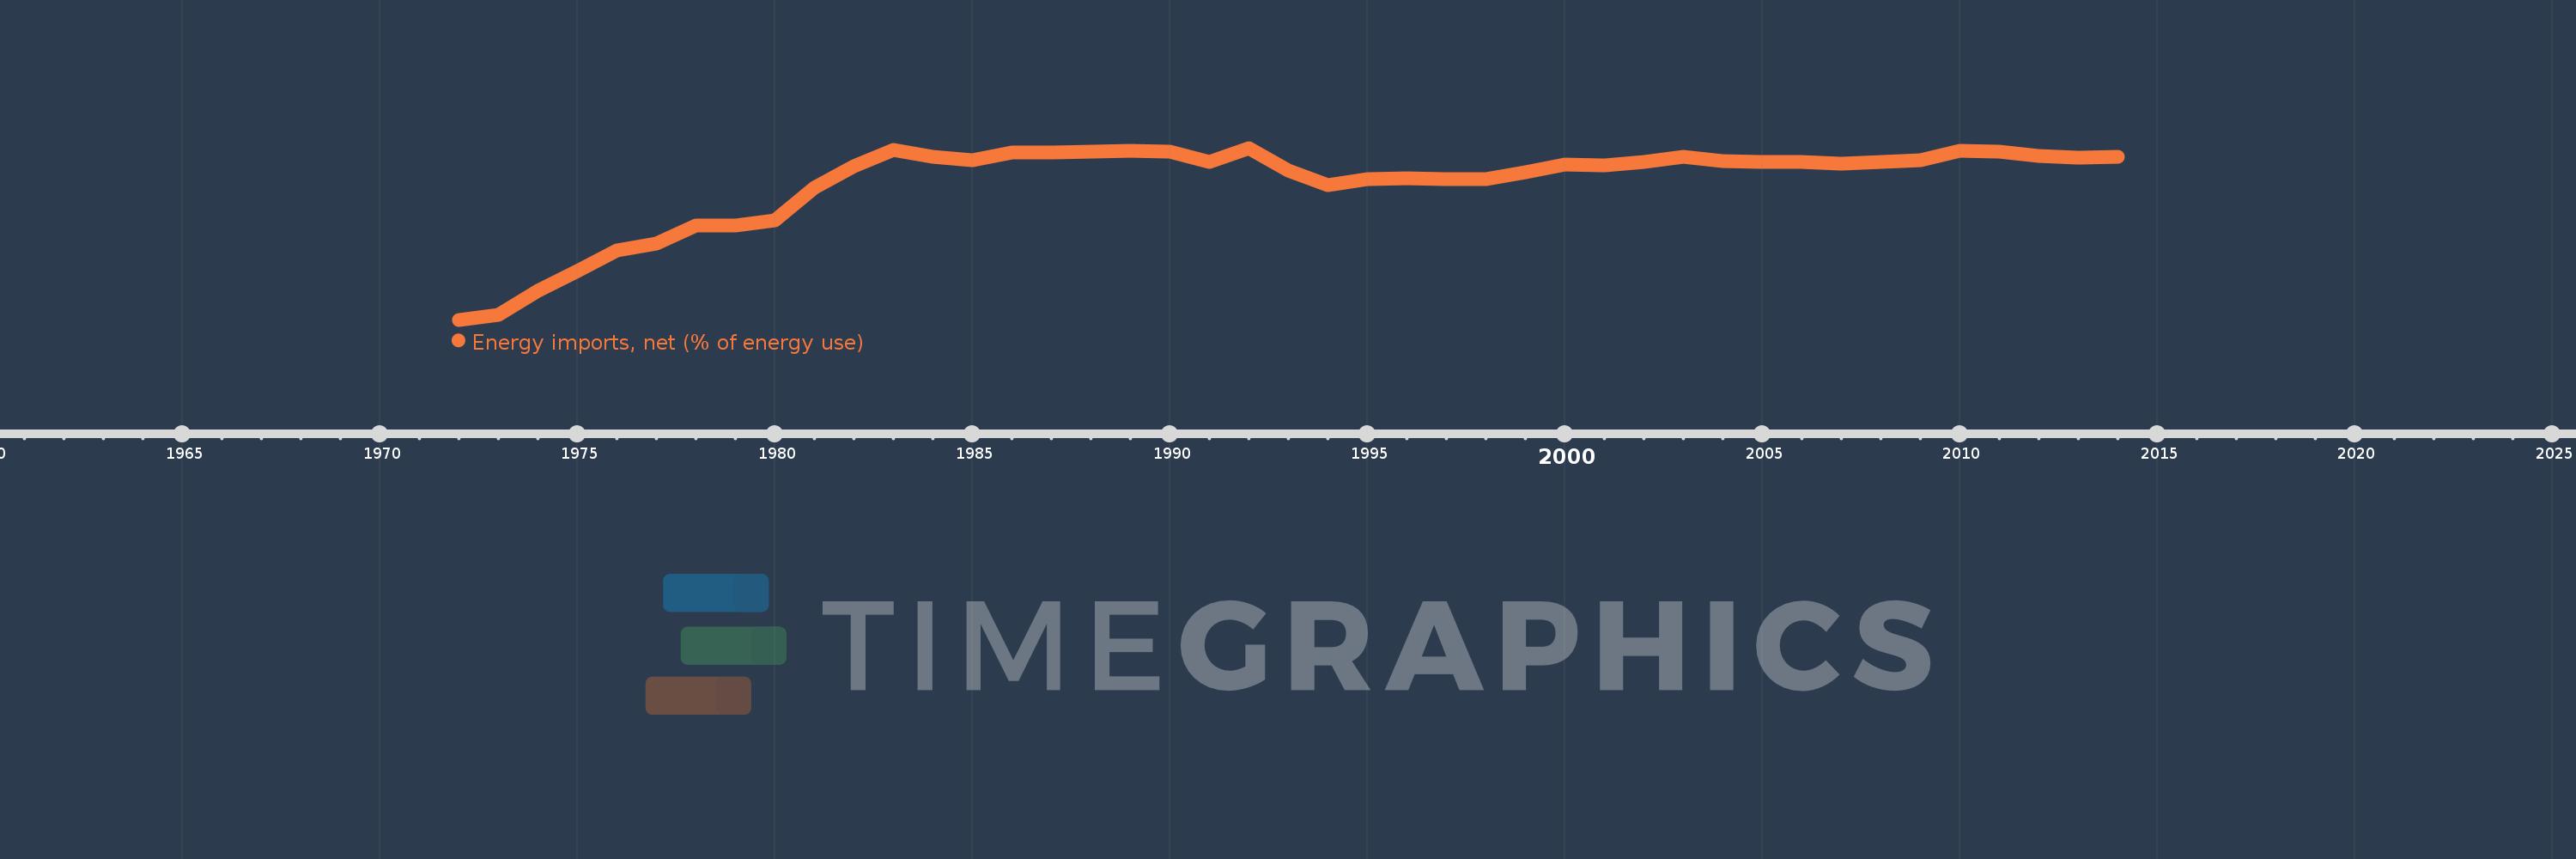
Energy imports, net (% of energy use)
2014,2013,2012,2011,2010,2009,2008,2007,2006,2005,2004,2003,2002,2001,2000,1999,1998,1997,1996,1995,1994,1993,1992,1991,1990,1989,1988,1987,1986,1985,1984,1983,1982,1981,1980,1979,1978,1977,1976,1975,1974,1973,1972
Queste statistiche in altri paesi:
AlbaniaAlgeriaAngolaArab WorldArgentinaArmeniaAustraliaAustriaAzerbaijanBahrainBangladeshBelarusBelgiumBeninBoliviaBosnia and HerzegovinaBotswanaBrazilBrunei DarussalamBulgariaCambodiaCameroonCanadaCaribbean small statesCentral Europe and the BalticsChileChinaColombiaCongo, Dem. Rep.Congo, Rep.Costa RicaCote d'IvoireCroatiaCubaCuracaoCyprusCzech RepublicDenmarkDominican RepublicEarly-demographic dividendEast Asia & PacificEast Asia & Pacific (excluding high income)East Asia & Pacific (IDA & IBRD countries)EcuadorEgypt, Arab Rep.El SalvadorEritreaEstoniaEthiopiaEuro areaEurope & Central AsiaEurope & Central Asia (excluding high income)Europe & Central Asia (IDA & IBRD countries)European UnionFinlandFragile and conflict affected situationsFranceGabonGeorgiaGermanyGhanaGibraltarGreeceGuatemalaHaitiHeavily indebted poor countries (HIPC)High incomeHondurasHong Kong SAR, ChinaHungaryIBRD onlyIcelandIDA & IBRD totalIDA blendIDA onlyIDA totalIndiaIndonesiaIran, Islamic Rep.IraqIrelandIsraelItalyJamaicaJapanJordanKazakhstanKenyaKorea, Dem. People’s Rep.Korea, Rep.KosovoKuwaitKyrgyz RepublicLate-demographic dividendLatin America & Caribbean Latin America & Caribbean (excluding high income)Latin America & the Caribbean (IDA & IBRD countries)LatviaLeast developed countries: UN classificationLebanonLibyaLithuaniaLow & middle incomeLow incomeLower middle incomeLuxembourgMacedonia, FYRMalaysiaMaltaMauritiusMexicoMiddle East & North AfricaMiddle East & North Africa (excluding high income)Middle East & North Africa (IDA & IBRD countries)Middle incomeMoldovaMongoliaMontenegroMoroccoMozambiqueMyanmarNamibiaNepalNetherlandsNew ZealandNicaraguaNigerNigeriaNorth AmericaNorwayOECD membersOmanOther small statesPakistanPanamaParaguayPeruPhilippinesPolandPortugalPost-demographic dividendPre-demographic dividendQatarRomaniaRussian FederationSaudi ArabiaSenegalSerbiaSingaporeSlovak RepublicSloveniaSmall statesSouth AfricaSouth AsiaSouth Asia (IDA & IBRD)South SudanSpainSri LankaSub-Saharan Africa Sub-Saharan Africa (excluding high income)Sub-Saharan Africa (IDA & IBRD countries)SudanSwedenSwitzerlandSyrian Arab RepublicTajikistanTanzaniaThailandTogoTrinidad and TobagoTunisiaTurkeyTurkmenistanUkraineUnited Arab EmiratesUnited KingdomUnited StatesUpper middle incomeUruguayUzbekistanVenezuela, RBVietnamWorldYemen, Rep.ZambiaZimbabwe Linea del tempo:
Questa scala temporale mostra un grafico dal 1972 anno al 2014 anno. Kuwait. I dati fino ad 1971 anno non disponibili. Il numero di osservazioni attuali secondo i date: 43.
La fonte (nome):
Indicatori dello sviluppo mondiale
La fonte (organizzazione):
IEA Statistics © OECD/IEA 2014 (http://www.iea.org/stats/index.asp), subject to https://www.iea.org/t&c/termsandconditions/
Categorie:
Energy & Mining, Trade
sono stati aggiornati
23 apr 2017 anni
Indicatori delle variazioni dei valori per anni
Minima:
-2.534 Mille.
1 gen 1972 anni
Massimo:
-273.306
1 gen 1992 anni
Alla data di osservazione
Valore
Variazione assoluta
La variazione rispetto al valore precedente
1 gen 1972 anni
-2.534 Mille.
-2.534 Mille.
0.0%
1 gen 1973 anni
-2.47 Mille.
+64.481
-2.54%
1 gen 1974 anni
-2.148 Mille.
+322.135
-13.04%
1 gen 1975 anni
-1.894 Mille.
+253.453
-11.8%
1 gen 1976 anni
-1.626 Mille.
+268.336
-14.17%
1 gen 1977 anni
-1.53 Mille.
+96.198
-5.92%
1 gen 1978 anni
-1.292 Mille.
+237.793
-15.55%
1 gen 1979 anni
-1.296 Mille.
-4.401
0.34%
1 gen 1980 anni
-1.228 Mille.
+68.274
-5.27%
1 gen 1981 anni
-795.388
+432.619
-35.23%
1 gen 1982 anni
-518.396
+276.992
-34.82%
1 gen 1983 anni
-304.876
+213.52
-41.19%
1 gen 1984 anni
-390.757
-85.881
28.17%
1 gen 1985 anni
-429.997
-39.24
10.04%
1 gen 1986 anni
-333.314
+96.683
-22.48%
1 gen 1987 anni
-328.482
+4.833
-1.45%
1 gen 1988 anni
-321.405
+7.077
-2.15%
1 gen 1989 anni
-311.061
+10.344
-3.22%
1 gen 1990 anni
-319.883
-8.822
2.84%
1 gen 1991 anni
-452.99
-133.107
41.61%
1 gen 1992 anni
-273.306
+179.685
-39.67%
1 gen 1993 anni
-573.391
-300.086
109.8%
1 gen 1994 anni
-762.177
-188.786
32.92%
1 gen 1995 anni
-685.92
+76.257
-10.01%
1 gen 1996 anni
-673.049
+12.87
-1.88%
1 gen 1997 anni
-688.06
-15.011
2.23%
1 gen 1998 anni
-679.601
+8.459
-1.23%
1 gen 1999 anni
-596.382
+83.219
-12.25%
1 gen 2000 anni
-495.146
+101.236
-16.98%
1 gen 2001 anni
-507.921
-12.775
2.58%
1 gen 2002 anni
-458.17
+49.751
-9.8%
1 gen 2003 anni
-388.589
+69.581
-15.19%
1 gen 2004 anni
-449.962
-61.373
15.79%
1 gen 2005 anni
-460.638
-10.676
2.37%
1 gen 2006 anni
-456.351
+4.287
-0.93%
1 gen 2007 anni
-485.654
-29.302
6.42%
1 gen 2008 anni
-456.714
+28.94
-5.96%
1 gen 2009 anni
-431.099
+25.614
-5.61%
1 gen 2010 anni
-313.943
+117.157
-27.18%
1 gen 2011 anni
-318.221
-4.278
1.36%
1 gen 2012 anni
-374.574
-56.353
17.71%
1 gen 2013 anni
-400.566
-25.993
6.94%
1 gen 2014 anni
-386.16
+14.406
-3.6%
Classificazione dei paesi secondo i statistiche attuali per anni


Commenti: