29
/it/
it
AIzaSyAYiBZKx7MnpbEhh9jyipgxe19OcubqV5w
April 1, 2024
210274
Nicaragua
NIC
true
2
1
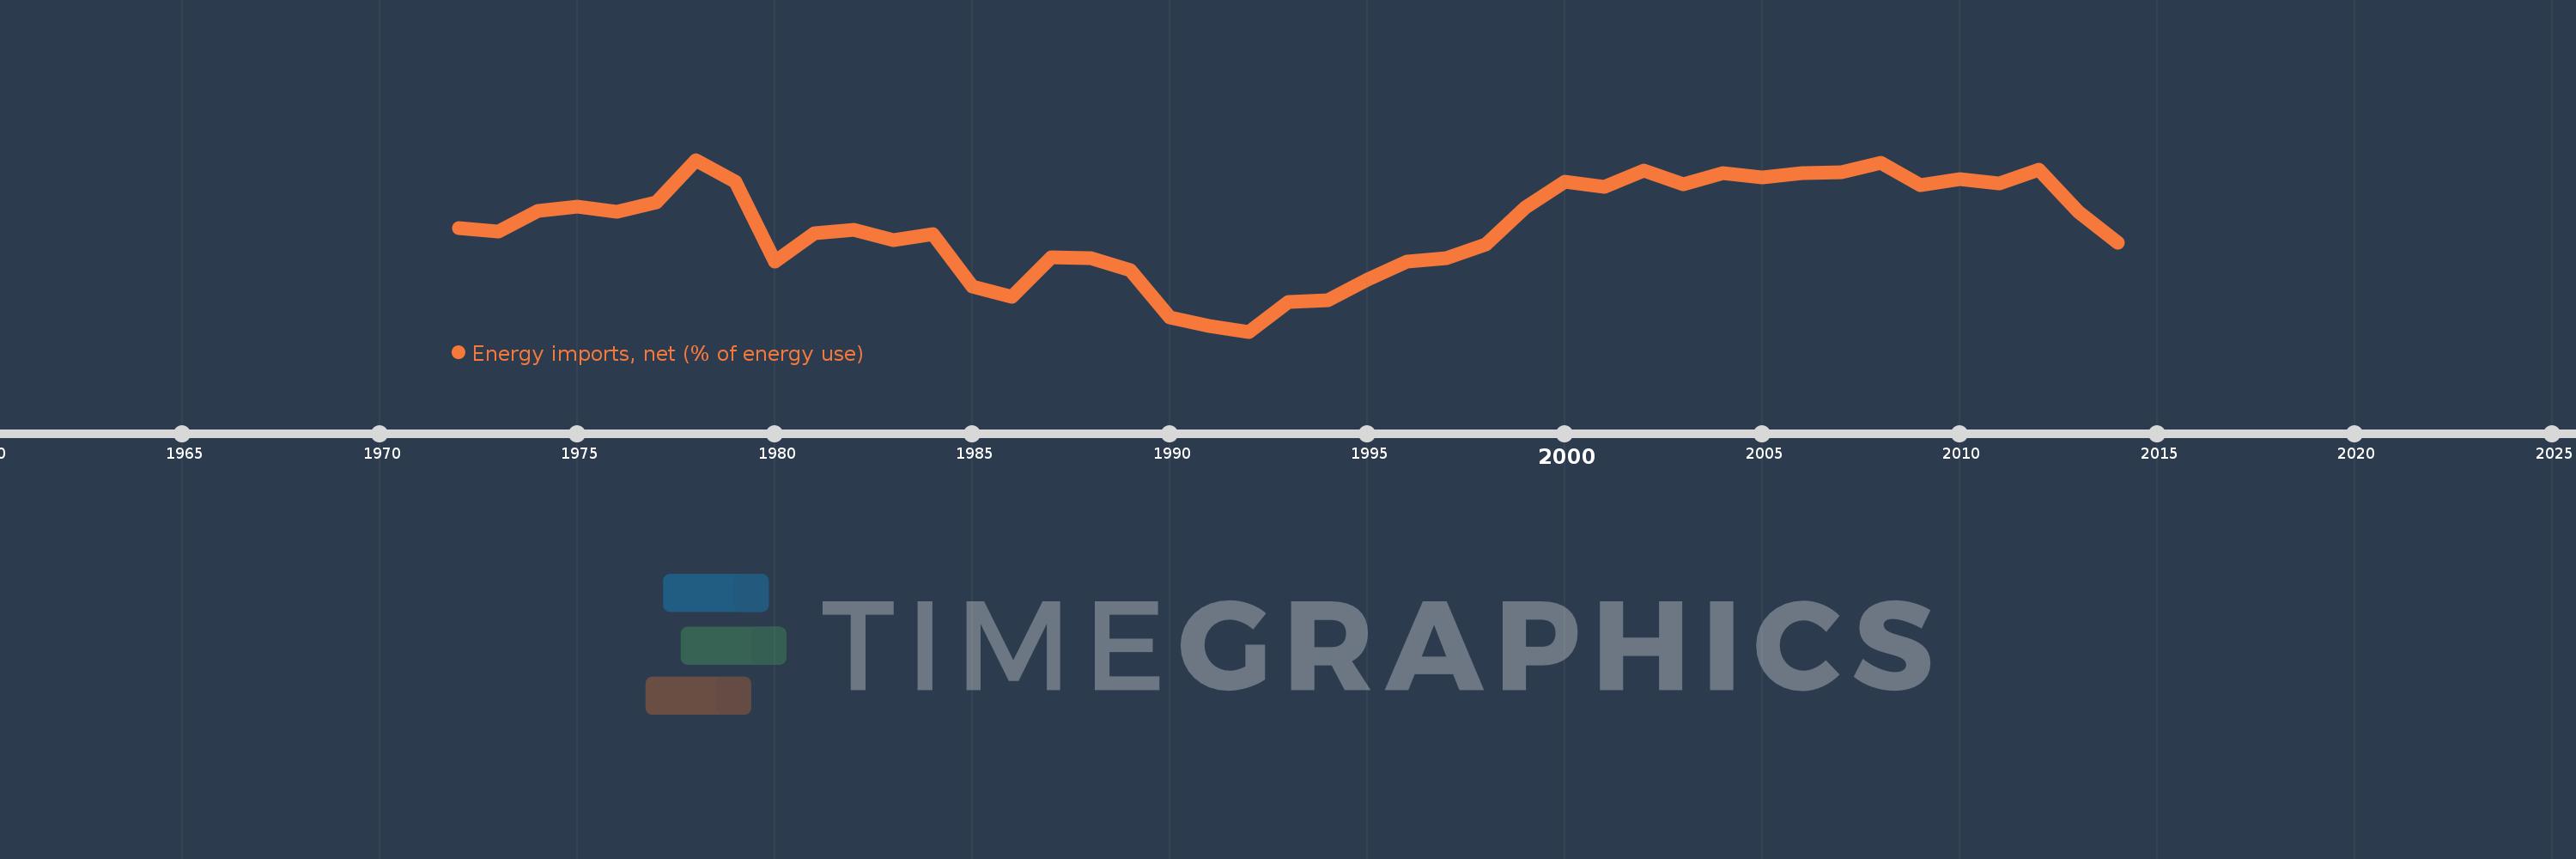
Energy imports, net (% of energy use)
2014,2013,2012,2011,2010,2009,2008,2007,2006,2005,2004,2003,2002,2001,2000,1999,1998,1997,1996,1995,1994,1993,1992,1991,1990,1989,1988,1987,1986,1985,1984,1983,1982,1981,1980,1979,1978,1977,1976,1975,1974,1973,1972
Queste statistiche in altri paesi:
AlbaniaAlgeriaAngolaArab WorldArgentinaArmeniaAustraliaAustriaAzerbaijanBahrainBangladeshBelarusBelgiumBeninBoliviaBosnia and HerzegovinaBotswanaBrazilBrunei DarussalamBulgariaCambodiaCameroonCanadaCaribbean small statesCentral Europe and the BalticsChileChinaColombiaCongo, Dem. Rep.Congo, Rep.Costa RicaCote d'IvoireCroatiaCubaCuracaoCyprusCzech RepublicDenmarkDominican RepublicEarly-demographic dividendEast Asia & PacificEast Asia & Pacific (excluding high income)East Asia & Pacific (IDA & IBRD countries)EcuadorEgypt, Arab Rep.El SalvadorEritreaEstoniaEthiopiaEuro areaEurope & Central AsiaEurope & Central Asia (excluding high income)Europe & Central Asia (IDA & IBRD countries)European UnionFinlandFragile and conflict affected situationsFranceGabonGeorgiaGermanyGhanaGibraltarGreeceGuatemalaHaitiHeavily indebted poor countries (HIPC)High incomeHondurasHong Kong SAR, ChinaHungaryIBRD onlyIcelandIDA & IBRD totalIDA blendIDA onlyIDA totalIndiaIndonesiaIran, Islamic Rep.IraqIrelandIsraelItalyJamaicaJapanJordanKazakhstanKenyaKorea, Dem. People’s Rep.Korea, Rep.KosovoKuwaitKyrgyz RepublicLate-demographic dividendLatin America & Caribbean Latin America & Caribbean (excluding high income)Latin America & the Caribbean (IDA & IBRD countries)LatviaLeast developed countries: UN classificationLebanonLibyaLithuaniaLow & middle incomeLow incomeLower middle incomeLuxembourgMacedonia, FYRMalaysiaMaltaMauritiusMexicoMiddle East & North AfricaMiddle East & North Africa (excluding high income)Middle East & North Africa (IDA & IBRD countries)Middle incomeMoldovaMongoliaMontenegroMoroccoMozambiqueMyanmarNamibiaNepalNetherlandsNew ZealandNicaraguaNigerNigeriaNorth AmericaNorwayOECD membersOmanOther small statesPakistanPanamaParaguayPeruPhilippinesPolandPortugalPost-demographic dividendPre-demographic dividendQatarRomaniaRussian FederationSaudi ArabiaSenegalSerbiaSingaporeSlovak RepublicSloveniaSmall statesSouth AfricaSouth AsiaSouth Asia (IDA & IBRD)South SudanSpainSri LankaSub-Saharan Africa Sub-Saharan Africa (excluding high income)Sub-Saharan Africa (IDA & IBRD countries)SudanSwedenSwitzerlandSyrian Arab RepublicTajikistanTanzaniaThailandTogoTrinidad and TobagoTunisiaTurkeyTurkmenistanUkraineUnited Arab EmiratesUnited KingdomUnited StatesUpper middle incomeUruguayUzbekistanVenezuela, RBVietnamWorldYemen, Rep.ZambiaZimbabwe Linea del tempo:
Questa scala temporale mostra un grafico dal 1972 anno al 2014 anno. Nicaragua. I dati fino ad 1971 anno non disponibili. Il numero di osservazioni attuali secondo i date: 43.
La fonte (nome):
Indicatori dello sviluppo mondiale
La fonte (organizzazione):
IEA Statistics © OECD/IEA 2014 (http://www.iea.org/stats/index.asp), subject to https://www.iea.org/t&c/termsandconditions/
Categorie:
Energy & Mining, Trade
sono stati aggiornati
23 apr 2017 anni
Indicatori delle variazioni dei valori per anni
Minima:
28.919
1 gen 1992 anni
Massimo:
49.685
1 gen 1978 anni
Alla data di osservazione
Valore
Variazione assoluta
La variazione rispetto al valore precedente
1 gen 1972 anni
41.385
+41.385
0.0%
1 gen 1973 anni
41.057
-0.327
-0.79%
1 gen 1974 anni
43.477
+2.419
5.89%
1 gen 1975 anni
44.062
+0.585
1.35%
1 gen 1976 anni
43.4
-0.661
-1.5%
1 gen 1977 anni
44.586
+1.185
2.73%
1 gen 1978 anni
49.685
+5.099
11.44%
1 gen 1979 anni
47.048
-2.637
-5.31%
1 gen 1980 anni
37.358
-9.69
-20.6%
1 gen 1981 anni
40.837
+3.479
9.31%
1 gen 1982 anni
41.197
+0.36
0.88%
1 gen 1983 anni
40.01
-1.187
-2.88%
1 gen 1984 anni
40.662
+0.652
1.63%
1 gen 1985 anni
34.358
-6.304
-15.5%
1 gen 1986 anni
33.146
-1.212
-3.53%
1 gen 1987 anni
37.942
+4.796
14.47%
1 gen 1988 anni
37.844
-0.098
-0.26%
1 gen 1989 anni
36.377
-1.467
-3.88%
1 gen 1990 anni
30.663
-5.714
-15.71%
1 gen 1991 anni
29.623
-1.041
-3.39%
1 gen 1992 anni
28.919
-0.704
-2.38%
1 gen 1993 anni
32.498
+3.579
12.37%
1 gen 1994 anni
32.688
+0.19
0.59%
1 gen 1995 anni
35.162
+2.474
7.57%
1 gen 1996 anni
37.334
+2.173
6.18%
1 gen 1997 anni
37.788
+0.453
1.21%
1 gen 1998 anni
39.485
+1.698
4.49%
1 gen 1999 anni
43.883
+4.398
11.14%
1 gen 2000 anni
47.036
+3.154
7.19%
1 gen 2001 anni
46.408
-0.629
-1.34%
1 gen 2002 anni
48.367
+1.959
4.22%
1 gen 2003 anni
46.719
-1.647
-3.41%
1 gen 2004 anni
48.081
+1.362
2.92%
1 gen 2005 anni
47.542
-0.54
-1.12%
1 gen 2006 anni
48.036
+0.494
1.04%
1 gen 2007 anni
48.224
+0.187
0.39%
1 gen 2008 anni
49.355
+1.131
2.35%
1 gen 2009 anni
46.594
-2.761
-5.59%
1 gen 2010 anni
47.342
+0.748
1.6%
1 gen 2011 anni
46.816
-0.525
-1.11%
1 gen 2012 anni
48.527
+1.71
3.65%
1 gen 2013 anni
43.356
-5.171
-10.66%
1 gen 2014 anni
39.716
-3.64
-8.39%
Classificazione dei paesi secondo i statistiche attuali per anni


Commenti: