29
/it/
it
AIzaSyAYiBZKx7MnpbEhh9jyipgxe19OcubqV5w
April 1, 2024
167398
Kenya
KEN
true
2
1
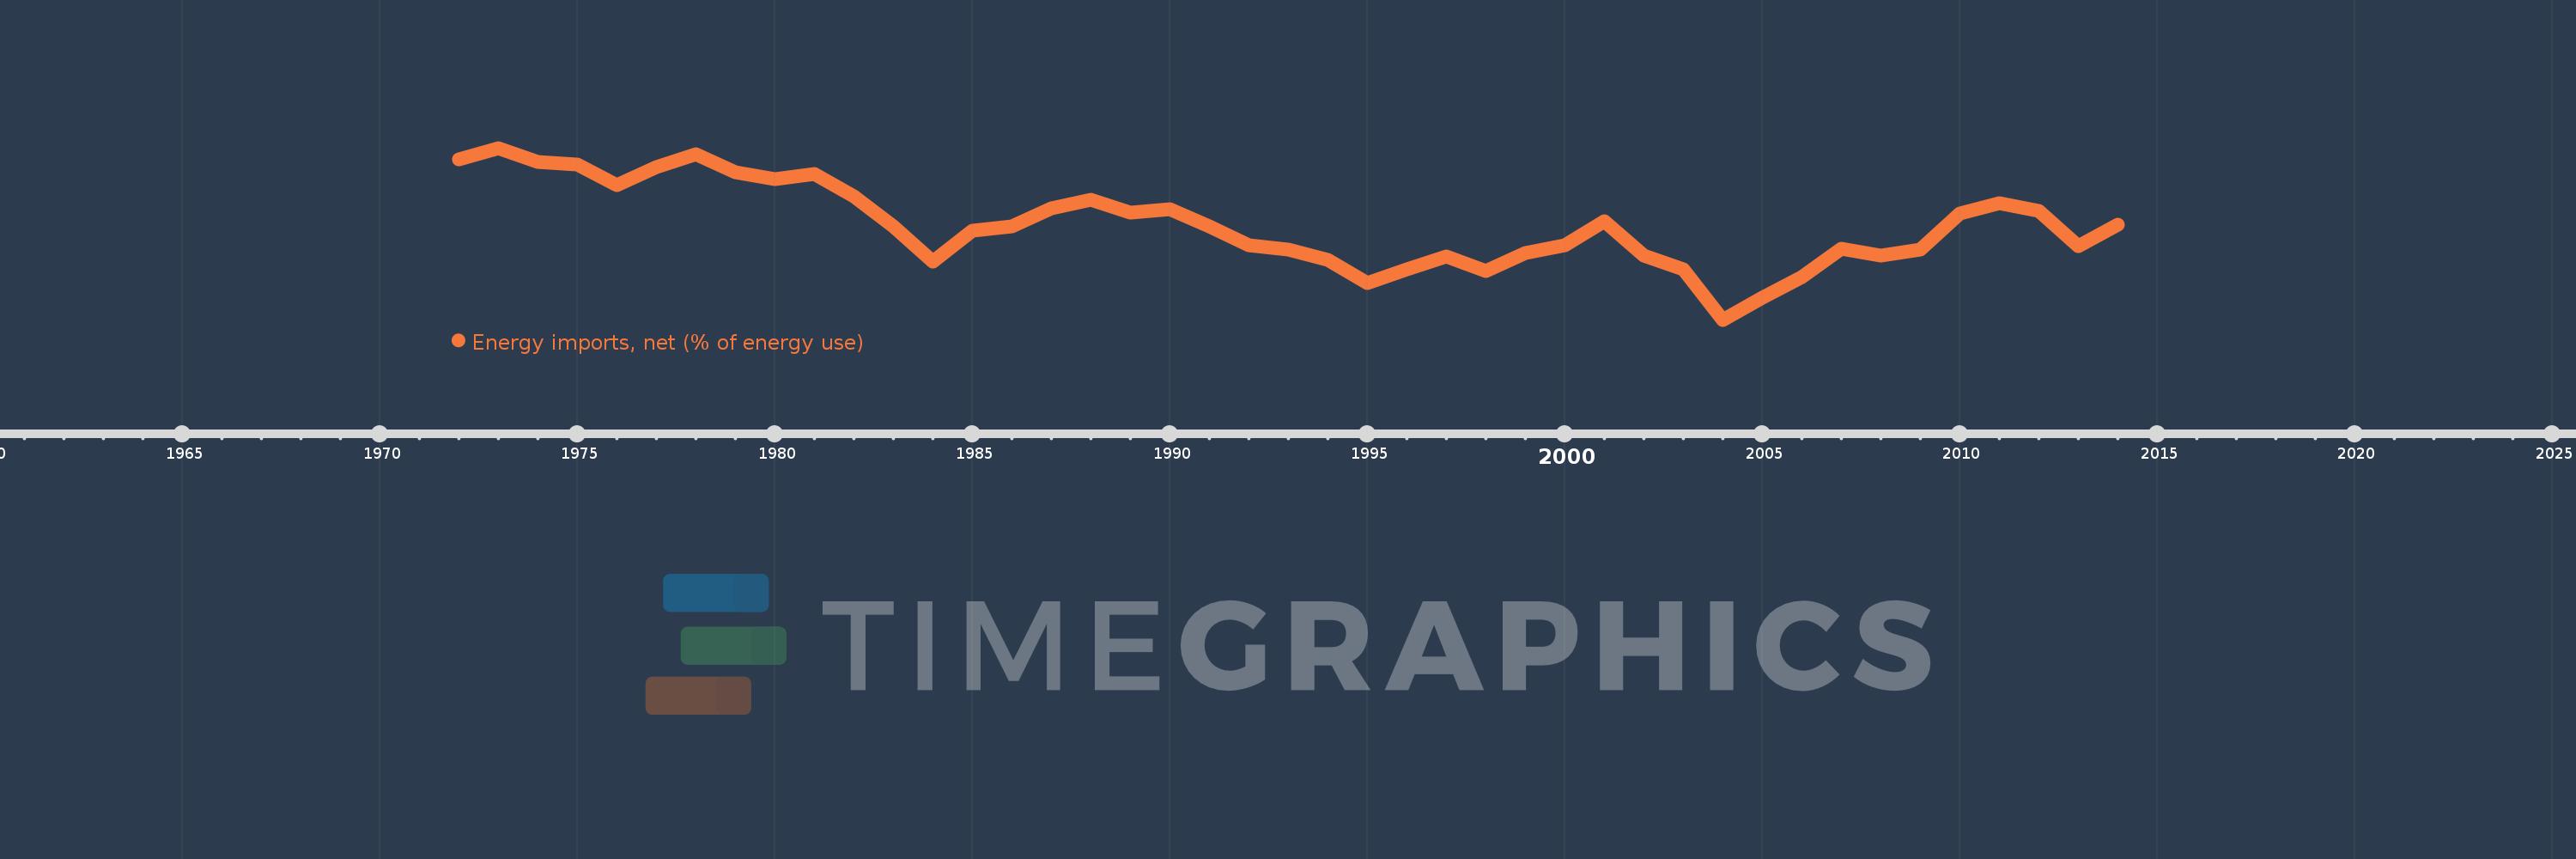
Energy imports, net (% of energy use)
2014,2013,2012,2011,2010,2009,2008,2007,2006,2005,2004,2003,2002,2001,2000,1999,1998,1997,1996,1995,1994,1993,1992,1991,1990,1989,1988,1987,1986,1985,1984,1983,1982,1981,1980,1979,1978,1977,1976,1975,1974,1973,1972
Queste statistiche in altri paesi:
AlbaniaAlgeriaAngolaArab WorldArgentinaArmeniaAustraliaAustriaAzerbaijanBahrainBangladeshBelarusBelgiumBeninBoliviaBosnia and HerzegovinaBotswanaBrazilBrunei DarussalamBulgariaCambodiaCameroonCanadaCaribbean small statesCentral Europe and the BalticsChileChinaColombiaCongo, Dem. Rep.Congo, Rep.Costa RicaCote d'IvoireCroatiaCubaCuracaoCyprusCzech RepublicDenmarkDominican RepublicEarly-demographic dividendEast Asia & PacificEast Asia & Pacific (excluding high income)East Asia & Pacific (IDA & IBRD countries)EcuadorEgypt, Arab Rep.El SalvadorEritreaEstoniaEthiopiaEuro areaEurope & Central AsiaEurope & Central Asia (excluding high income)Europe & Central Asia (IDA & IBRD countries)European UnionFinlandFragile and conflict affected situationsFranceGabonGeorgiaGermanyGhanaGibraltarGreeceGuatemalaHaitiHeavily indebted poor countries (HIPC)High incomeHondurasHong Kong SAR, ChinaHungaryIBRD onlyIcelandIDA & IBRD totalIDA blendIDA onlyIDA totalIndiaIndonesiaIran, Islamic Rep.IraqIrelandIsraelItalyJamaicaJapanJordanKazakhstanKenyaKorea, Dem. People’s Rep.Korea, Rep.KosovoKuwaitKyrgyz RepublicLate-demographic dividendLatin America & Caribbean Latin America & Caribbean (excluding high income)Latin America & the Caribbean (IDA & IBRD countries)LatviaLeast developed countries: UN classificationLebanonLibyaLithuaniaLow & middle incomeLow incomeLower middle incomeLuxembourgMacedonia, FYRMalaysiaMaltaMauritiusMexicoMiddle East & North AfricaMiddle East & North Africa (excluding high income)Middle East & North Africa (IDA & IBRD countries)Middle incomeMoldovaMongoliaMontenegroMoroccoMozambiqueMyanmarNamibiaNepalNetherlandsNew ZealandNicaraguaNigerNigeriaNorth AmericaNorwayOECD membersOmanOther small statesPakistanPanamaParaguayPeruPhilippinesPolandPortugalPost-demographic dividendPre-demographic dividendQatarRomaniaRussian FederationSaudi ArabiaSenegalSerbiaSingaporeSlovak RepublicSloveniaSmall statesSouth AfricaSouth AsiaSouth Asia (IDA & IBRD)South SudanSpainSri LankaSub-Saharan Africa Sub-Saharan Africa (excluding high income)Sub-Saharan Africa (IDA & IBRD countries)SudanSwedenSwitzerlandSyrian Arab RepublicTajikistanTanzaniaThailandTogoTrinidad and TobagoTunisiaTurkeyTurkmenistanUkraineUnited Arab EmiratesUnited KingdomUnited StatesUpper middle incomeUruguayUzbekistanVenezuela, RBVietnamWorldYemen, Rep.ZambiaZimbabwe Linea del tempo:
Questa scala temporale mostra un grafico dal 1972 anno al 2014 anno. Kenya. I dati fino ad 1971 anno non disponibili. Il numero di osservazioni attuali secondo i date: 43.
La fonte (nome):
Indicatori dello sviluppo mondiale
La fonte (organizzazione):
IEA Statistics © OECD/IEA 2014 (http://www.iea.org/stats/index.asp), subject to https://www.iea.org/t&c/termsandconditions/
Categorie:
Energy & Mining, Trade
sono stati aggiornati
23 apr 2017 anni
Indicatori delle variazioni dei valori per anni
Minima:
13.057
1 gen 2004 anni
Massimo:
22.273
1 gen 1973 anni
Alla data di osservazione
Valore
Variazione assoluta
La variazione rispetto al valore precedente
1 gen 1972 anni
21.656
+21.656
0.0%
1 gen 1973 anni
22.273
+0.617
2.85%
1 gen 1974 anni
21.502
-0.771
-3.46%
1 gen 1975 anni
21.378
-0.123
-0.57%
1 gen 1976 anni
20.264
-1.114
-5.21%
1 gen 1977 anni
21.24
+0.975
4.81%
1 gen 1978 anni
21.945
+0.705
3.32%
1 gen 1979 anni
20.986
-0.959
-4.37%
1 gen 1980 anni
20.6
-0.386
-1.84%
1 gen 1981 anni
20.859
+0.258
1.25%
1 gen 1982 anni
19.693
-1.166
-5.59%
1 gen 1983 anni
18.076
-1.616
-8.21%
1 gen 1984 anni
16.18
-1.896
-10.49%
1 gen 1985 anni
17.845
+1.665
10.29%
1 gen 1986 anni
18.074
+0.229
1.28%
1 gen 1987 anni
19.05
+0.976
5.4%
1 gen 1988 anni
19.496
+0.447
2.34%
1 gen 1989 anni
18.797
-0.7
-3.59%
1 gen 1990 anni
18.978
+0.181
0.97%
1 gen 1991 anni
18.084
-0.894
-4.71%
1 gen 1992 anni
17.035
-1.049
-5.8%
1 gen 1993 anni
16.82
-0.215
-1.26%
1 gen 1994 anni
16.246
-0.574
-3.41%
1 gen 1995 anni
15.047
-1.199
-7.38%
1 gen 1996 anni
15.759
+0.711
4.73%
1 gen 1997 anni
16.467
+0.709
4.5%
1 gen 1998 anni
15.69
-0.777
-4.72%
1 gen 1999 anni
16.645
+0.955
6.08%
1 gen 2000 anni
17.074
+0.429
2.58%
1 gen 2001 anni
18.36
+1.287
7.54%
1 gen 2002 anni
16.51
-1.85
-10.07%
1 gen 2003 anni
15.762
-0.749
-4.54%
1 gen 2004 anni
13.057
-2.704
-17.16%
1 gen 2005 anni
14.221
+1.164
8.91%
1 gen 2006 anni
15.342
+1.12
7.88%
1 gen 2007 anni
16.884
+1.542
10.05%
1 gen 2008 anni
16.482
-0.402
-2.38%
1 gen 2009 anni
16.822
+0.34
2.06%
1 gen 2010 anni
18.751
+1.93
11.47%
1 gen 2011 anni
19.293
+0.542
2.89%
1 gen 2012 anni
18.913
-0.381
-1.97%
1 gen 2013 anni
17.02
-1.893
-10.01%
1 gen 2014 anni
18.152
+1.132
6.65%
Classificazione dei paesi secondo i statistiche attuali per anni


Commenti: