29
/it/
it
AIzaSyAYiBZKx7MnpbEhh9jyipgxe19OcubqV5w
April 1, 2024
141730
Greece
GRC
true
2
1
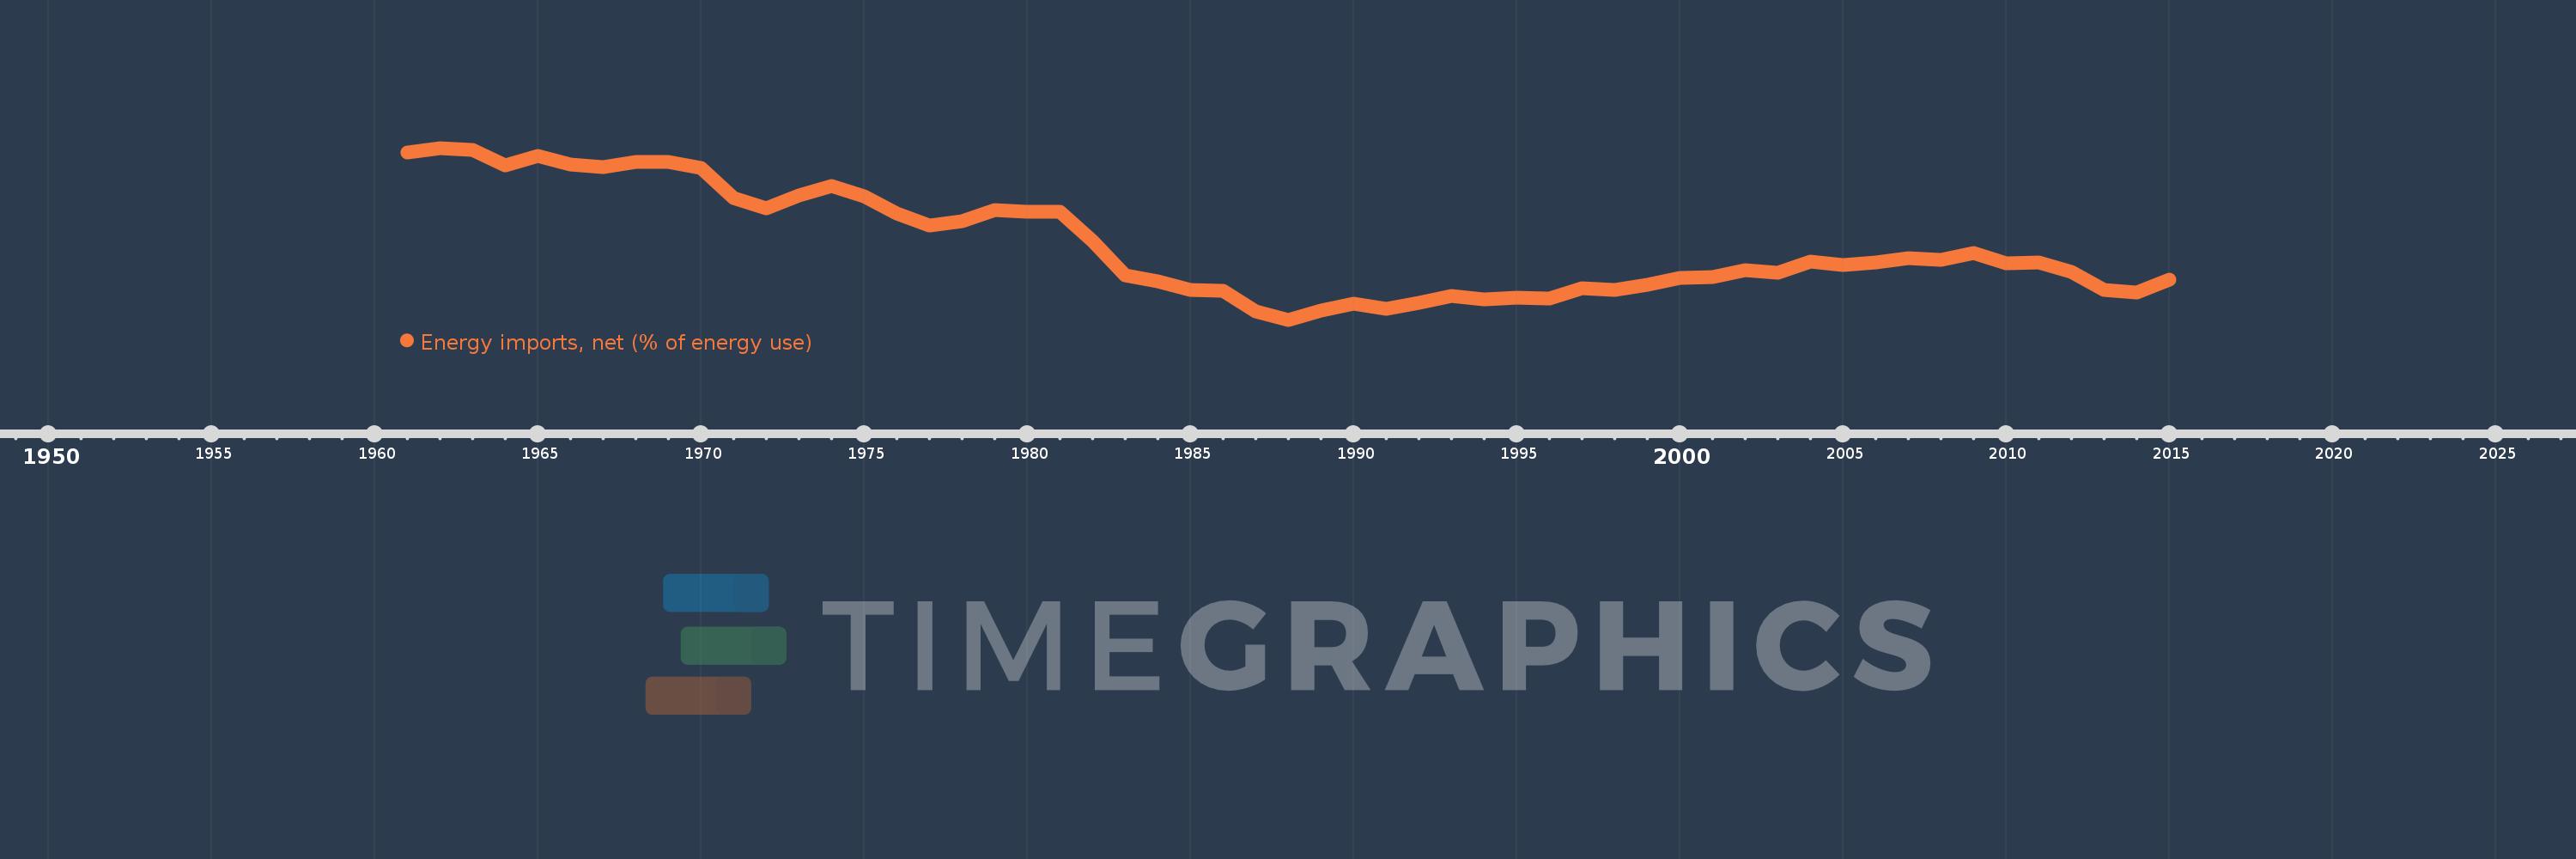
Energy imports, net (% of energy use)
2015,2014,2013,2012,2011,2010,2009,2008,2007,2006,2005,2004,2003,2002,2001,2000,1999,1998,1997,1996,1995,1994,1993,1992,1991,1990,1989,1988,1987,1986,1985,1984,1983,1982,1981,1980,1979,1978,1977,1976,1975,1974,1973,1972,1971,1970,1969,1968,1967,1966,1965,1964,1963,1962,1961
Queste statistiche in altri paesi:
AlbaniaAlgeriaAngolaArab WorldArgentinaArmeniaAustraliaAustriaAzerbaijanBahrainBangladeshBelarusBelgiumBeninBoliviaBosnia and HerzegovinaBotswanaBrazilBrunei DarussalamBulgariaCambodiaCameroonCanadaCaribbean small statesCentral Europe and the BalticsChileChinaColombiaCongo, Dem. Rep.Congo, Rep.Costa RicaCote d'IvoireCroatiaCubaCuracaoCyprusCzech RepublicDenmarkDominican RepublicEarly-demographic dividendEast Asia & PacificEast Asia & Pacific (excluding high income)East Asia & Pacific (IDA & IBRD countries)EcuadorEgypt, Arab Rep.El SalvadorEritreaEstoniaEthiopiaEuro areaEurope & Central AsiaEurope & Central Asia (excluding high income)Europe & Central Asia (IDA & IBRD countries)European UnionFinlandFragile and conflict affected situationsFranceGabonGeorgiaGermanyGhanaGibraltarGreeceGuatemalaHaitiHeavily indebted poor countries (HIPC)High incomeHondurasHong Kong SAR, ChinaHungaryIBRD onlyIcelandIDA & IBRD totalIDA blendIDA onlyIDA totalIndiaIndonesiaIran, Islamic Rep.IraqIrelandIsraelItalyJamaicaJapanJordanKazakhstanKenyaKorea, Dem. People’s Rep.Korea, Rep.KosovoKuwaitKyrgyz RepublicLate-demographic dividendLatin America & Caribbean Latin America & Caribbean (excluding high income)Latin America & the Caribbean (IDA & IBRD countries)LatviaLeast developed countries: UN classificationLebanonLibyaLithuaniaLow & middle incomeLow incomeLower middle incomeLuxembourgMacedonia, FYRMalaysiaMaltaMauritiusMexicoMiddle East & North AfricaMiddle East & North Africa (excluding high income)Middle East & North Africa (IDA & IBRD countries)Middle incomeMoldovaMongoliaMontenegroMoroccoMozambiqueMyanmarNamibiaNepalNetherlandsNew ZealandNicaraguaNigerNigeriaNorth AmericaNorwayOECD membersOmanOther small statesPakistanPanamaParaguayPeruPhilippinesPolandPortugalPost-demographic dividendPre-demographic dividendQatarRomaniaRussian FederationSaudi ArabiaSenegalSerbiaSingaporeSlovak RepublicSloveniaSmall statesSouth AfricaSouth AsiaSouth Asia (IDA & IBRD)South SudanSpainSri LankaSub-Saharan Africa Sub-Saharan Africa (excluding high income)Sub-Saharan Africa (IDA & IBRD countries)SudanSwedenSwitzerlandSyrian Arab RepublicTajikistanTanzaniaThailandTogoTrinidad and TobagoTunisiaTurkeyTurkmenistanUkraineUnited Arab EmiratesUnited KingdomUnited StatesUpper middle incomeUruguayUzbekistanVenezuela, RBVietnamWorldYemen, Rep.ZambiaZimbabwe Linea del tempo:
Questa scala temporale mostra un grafico dal 1961 anno al 2015 anno. Greece. I dati fino ad 1960 anno non disponibili. Il numero di osservazioni attuali secondo i date: 55.
La fonte (nome):
Indicatori dello sviluppo mondiale
La fonte (organizzazione):
IEA Statistics © OECD/IEA 2014 (http://www.iea.org/stats/index.asp), subject to https://www.iea.org/t&c/termsandconditions/
Categorie:
Energy & Mining, Trade
sono stati aggiornati
23 apr 2017 anni
Indicatori delle variazioni dei valori per anni
Minima:
55.074
1 gen 1988 anni
Massimo:
87.395
1 gen 1962 anni
Alla data di osservazione
Valore
Variazione assoluta
La variazione rispetto al valore precedente
1 gen 1961 anni
86.615
+86.615
0.0%
1 gen 1962 anni
87.395
+0.78
0.9%
1 gen 1963 anni
86.983
-0.413
-0.47%
1 gen 1964 anni
84.125
-2.857
-3.28%
1 gen 1965 anni
85.907
+1.782
2.12%
1 gen 1966 anni
84.338
-1.569
-1.83%
1 gen 1967 anni
83.782
-0.556
-0.66%
1 gen 1968 anni
84.84
+1.058
1.26%
1 gen 1969 anni
84.785
-0.055
-0.07%
1 gen 1970 anni
83.675
-1.11
-1.31%
1 gen 1971 anni
78.002
-5.672
-6.78%
1 gen 1972 anni
76.008
-1.994
-2.56%
1 gen 1973 anni
78.511
+2.503
3.29%
1 gen 1974 anni
80.236
+1.725
2.2%
1 gen 1975 anni
78.273
-1.963
-2.45%
1 gen 1976 anni
75.076
-3.197
-4.08%
1 gen 1977 anni
72.863
-2.213
-2.95%
1 gen 1978 anni
73.566
+0.703
0.96%
1 gen 1979 anni
75.78
+2.214
3.01%
1 gen 1980 anni
75.332
-0.448
-0.59%
1 gen 1981 anni
75.331
-0.001
0.0%
1 gen 1982 anni
69.842
-5.489
-7.29%
1 gen 1983 anni
63.379
-6.463
-9.25%
1 gen 1984 anni
62.227
-1.152
-1.82%
1 gen 1985 anni
60.722
-1.505
-2.42%
1 gen 1986 anni
60.504
-0.218
-0.36%
1 gen 1987 anni
56.693
-3.81
-6.3%
1 gen 1988 anni
55.074
-1.62
-2.86%
1 gen 1989 anni
56.799
+1.725
3.13%
1 gen 1990 anni
58.056
+1.257
2.21%
1 gen 1991 anni
57.099
-0.958
-1.65%
1 gen 1992 anni
58.202
+1.104
1.93%
1 gen 1993 anni
59.566
+1.364
2.34%
1 gen 1994 anni
58.95
-0.616
-1.03%
1 gen 1995 anni
59.296
+0.345
0.59%
1 gen 1996 anni
58.999
-0.297
-0.5%
1 gen 1997 anni
61.031
+2.032
3.44%
1 gen 1998 anni
60.713
-0.318
-0.52%
1 gen 1999 anni
61.625
+0.912
1.5%
1 gen 2000 anni
62.932
+1.307
2.12%
1 gen 2001 anni
63.132
+0.2
0.32%
1 gen 2002 anni
64.417
+1.284
2.03%
1 gen 2003 anni
63.883
-0.534
-0.83%
1 gen 2004 anni
66.009
+2.126
3.33%
1 gen 2005 anni
65.321
-0.688
-1.04%
1 gen 2006 anni
65.899
+0.578
0.88%
1 gen 2007 anni
66.691
+0.792
1.2%
1 gen 2008 anni
66.339
-0.352
-0.53%
1 gen 2009 anni
67.578
+1.239
1.87%
1 gen 2010 anni
65.761
-1.816
-2.69%
1 gen 2011 anni
65.809
+0.048
0.07%
1 gen 2012 anni
64.011
-1.798
-2.73%
1 gen 2013 anni
60.747
-3.263
-5.1%
1 gen 2014 anni
60.2
-0.547
-0.9%
1 gen 2015 anni
62.616
+2.416
4.01%
Classificazione dei paesi secondo i statistiche attuali per anni


Commenti: