29
/it/
it
AIzaSyAYiBZKx7MnpbEhh9jyipgxe19OcubqV5w
April 1, 2024
212868
Nigeria
NGA
true
2
1
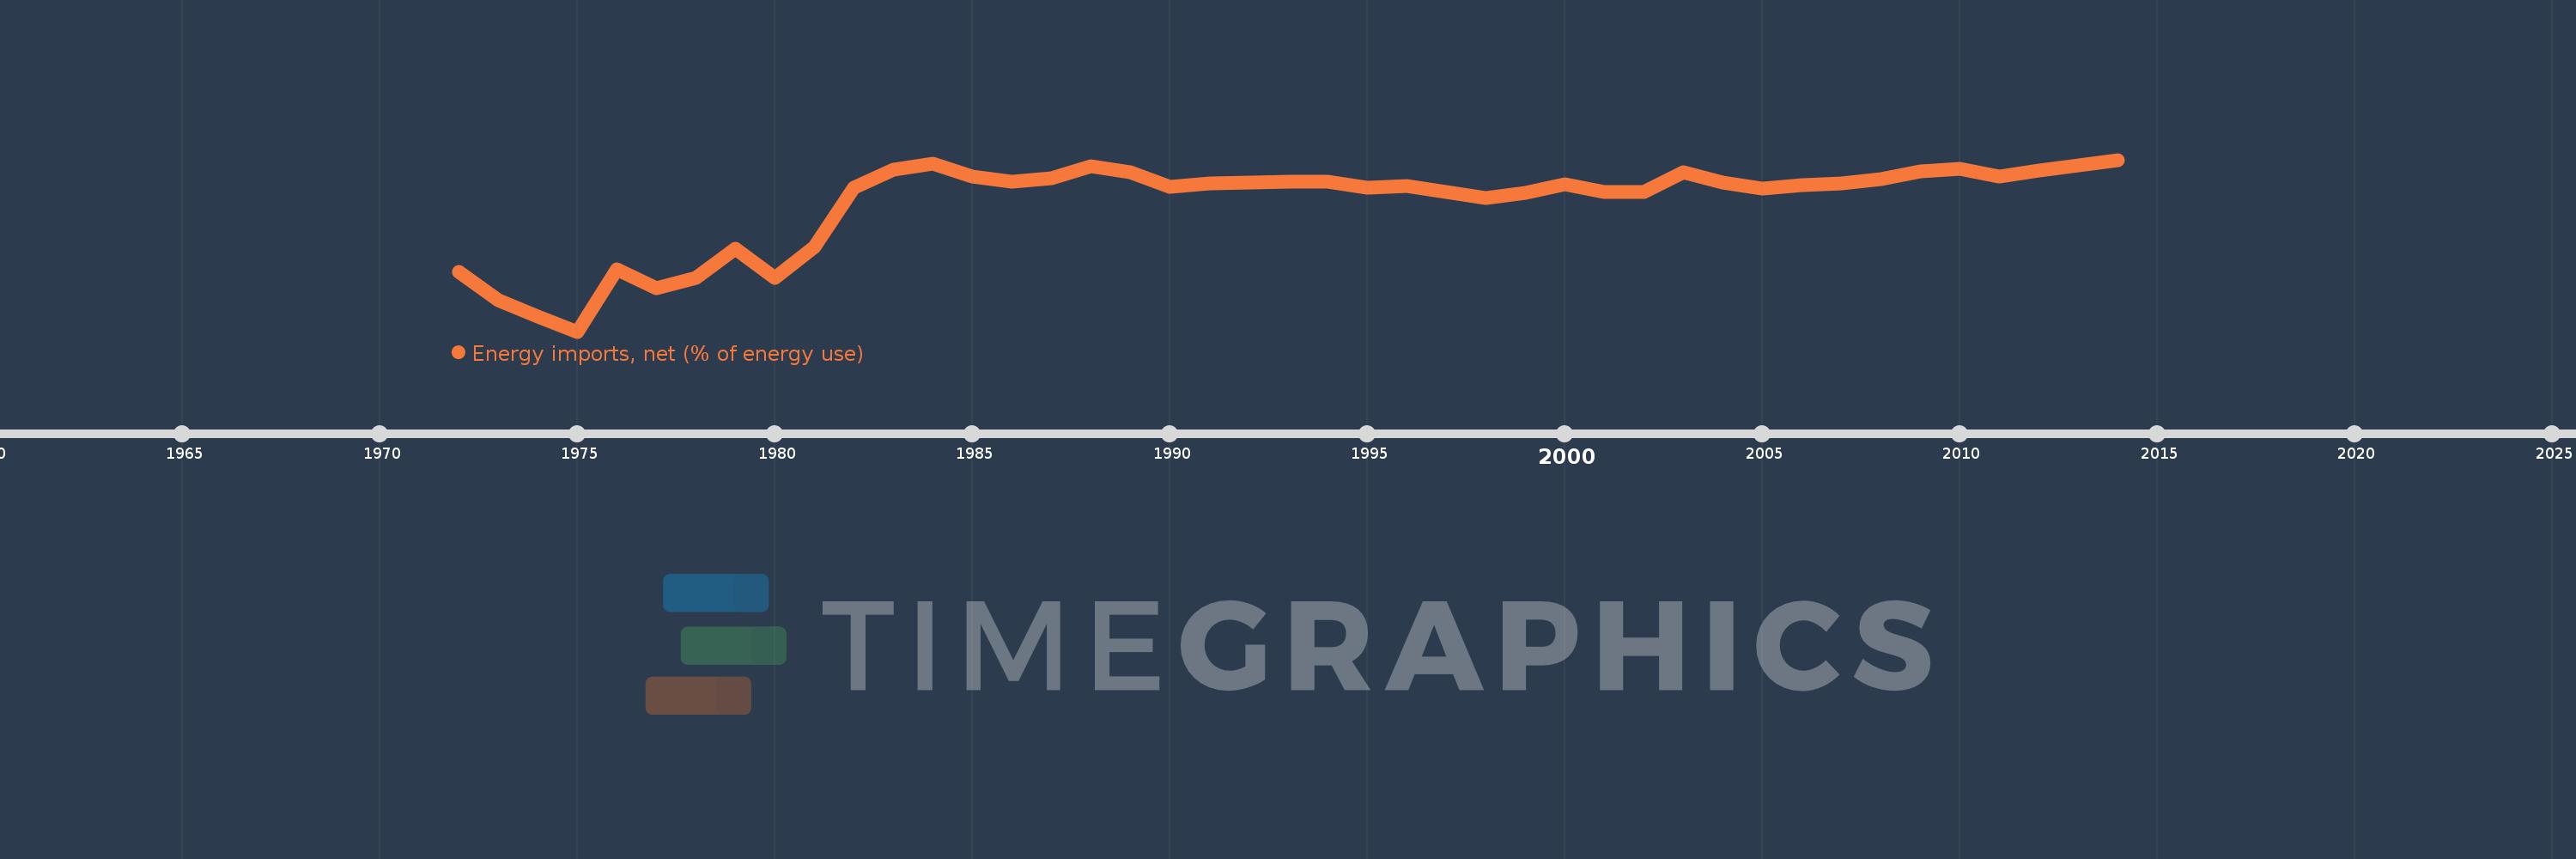
Energy imports, net (% of energy use)
2014,2013,2012,2011,2010,2009,2008,2007,2006,2005,2004,2003,2002,2001,2000,1999,1998,1997,1996,1995,1994,1993,1992,1991,1990,1989,1988,1987,1986,1985,1984,1983,1982,1981,1980,1979,1978,1977,1976,1975,1974,1973,1972
Queste statistiche in altri paesi:
AlbaniaAlgeriaAngolaArab WorldArgentinaArmeniaAustraliaAustriaAzerbaijanBahrainBangladeshBelarusBelgiumBeninBoliviaBosnia and HerzegovinaBotswanaBrazilBrunei DarussalamBulgariaCambodiaCameroonCanadaCaribbean small statesCentral Europe and the BalticsChileChinaColombiaCongo, Dem. Rep.Congo, Rep.Costa RicaCote d'IvoireCroatiaCubaCuracaoCyprusCzech RepublicDenmarkDominican RepublicEarly-demographic dividendEast Asia & PacificEast Asia & Pacific (excluding high income)East Asia & Pacific (IDA & IBRD countries)EcuadorEgypt, Arab Rep.El SalvadorEritreaEstoniaEthiopiaEuro areaEurope & Central AsiaEurope & Central Asia (excluding high income)Europe & Central Asia (IDA & IBRD countries)European UnionFinlandFragile and conflict affected situationsFranceGabonGeorgiaGermanyGhanaGibraltarGreeceGuatemalaHaitiHeavily indebted poor countries (HIPC)High incomeHondurasHong Kong SAR, ChinaHungaryIBRD onlyIcelandIDA & IBRD totalIDA blendIDA onlyIDA totalIndiaIndonesiaIran, Islamic Rep.IraqIrelandIsraelItalyJamaicaJapanJordanKazakhstanKenyaKorea, Dem. People’s Rep.Korea, Rep.KosovoKuwaitKyrgyz RepublicLate-demographic dividendLatin America & Caribbean Latin America & Caribbean (excluding high income)Latin America & the Caribbean (IDA & IBRD countries)LatviaLeast developed countries: UN classificationLebanonLibyaLithuaniaLow & middle incomeLow incomeLower middle incomeLuxembourgMacedonia, FYRMalaysiaMaltaMauritiusMexicoMiddle East & North AfricaMiddle East & North Africa (excluding high income)Middle East & North Africa (IDA & IBRD countries)Middle incomeMoldovaMongoliaMontenegroMoroccoMozambiqueMyanmarNamibiaNepalNetherlandsNew ZealandNicaraguaNigerNigeriaNorth AmericaNorwayOECD membersOmanOther small statesPakistanPanamaParaguayPeruPhilippinesPolandPortugalPost-demographic dividendPre-demographic dividendQatarRomaniaRussian FederationSaudi ArabiaSenegalSerbiaSingaporeSlovak RepublicSloveniaSmall statesSouth AfricaSouth AsiaSouth Asia (IDA & IBRD)South SudanSpainSri LankaSub-Saharan Africa Sub-Saharan Africa (excluding high income)Sub-Saharan Africa (IDA & IBRD countries)SudanSwedenSwitzerlandSyrian Arab RepublicTajikistanTanzaniaThailandTogoTrinidad and TobagoTunisiaTurkeyTurkmenistanUkraineUnited Arab EmiratesUnited KingdomUnited StatesUpper middle incomeUruguayUzbekistanVenezuela, RBVietnamWorldYemen, Rep.ZambiaZimbabwe Linea del tempo:
Questa scala temporale mostra un grafico dal 1972 anno al 2014 anno. Nigeria. I dati fino ad 1971 anno non disponibili. Il numero di osservazioni attuali secondo i date: 43.
La fonte (nome):
Indicatori dello sviluppo mondiale
La fonte (organizzazione):
IEA Statistics © OECD/IEA 2014 (http://www.iea.org/stats/index.asp), subject to https://www.iea.org/t&c/termsandconditions/
Categorie:
Energy & Mining, Trade
sono stati aggiornati
23 apr 2017 anni
Indicatori delle variazioni dei valori per anni
Minima:
-299.177
1 gen 1975 anni
Massimo:
-91.376
1 gen 2014 anni
Alla data di osservazione
Valore
Variazione assoluta
La variazione rispetto al valore precedente
1 gen 1972 anni
-227.322
-227.322
0.0%
1 gen 1973 anni
-261.625
-34.303
15.09%
1 gen 1974 anni
-281.426
-19.801
7.57%
1 gen 1975 anni
-299.177
-17.75
6.31%
1 gen 1976 anni
-224.281
+74.896
-25.03%
1 gen 1977 anni
-246.85
-22.569
10.06%
1 gen 1978 anni
-234.371
+12.479
-5.06%
1 gen 1979 anni
-199.018
+35.353
-15.08%
1 gen 1980 anni
-233.898
-34.88
17.53%
1 gen 1981 anni
-196.523
+37.374
-15.98%
1 gen 1982 anni
-125.504
+71.02
-36.14%
1 gen 1983 anni
-103.303
+22.201
-17.69%
1 gen 1984 anni
-95.672
+7.631
-7.39%
1 gen 1985 anni
-111.661
-15.989
16.71%
1 gen 1986 anni
-117.386
-5.725
5.13%
1 gen 1987 anni
-114.168
+3.218
-2.74%
1 gen 1988 anni
-98.942
+15.226
-13.34%
1 gen 1989 anni
-106.867
-7.925
8.01%
1 gen 1990 anni
-123.823
-16.956
15.87%
1 gen 1991 anni
-120.247
+3.576
-2.89%
1 gen 1992 anni
-119.057
+1.191
-0.99%
1 gen 1993 anni
-117.893
+1.164
-0.98%
1 gen 1994 anni
-118.239
-0.346
0.29%
1 gen 1995 anni
-125.434
-7.195
6.09%
1 gen 1996 anni
-123.371
+2.063
-1.64%
1 gen 1997 anni
-130.551
-7.179
5.82%
1 gen 1998 anni
-137.664
-7.113
5.45%
1 gen 1999 anni
-130.863
+6.802
-4.94%
1 gen 2000 anni
-121.054
+9.809
-7.5%
1 gen 2001 anni
-130.05
-8.996
7.43%
1 gen 2002 anni
-130.021
+0.03
-0.02%
1 gen 2003 anni
-106.185
+23.836
-18.33%
1 gen 2004 anni
-118.87
-12.686
11.95%
1 gen 2005 anni
-126.565
-7.694
6.47%
1 gen 2006 anni
-121.808
+4.757
-3.76%
1 gen 2007 anni
-119.662
+2.146
-1.76%
1 gen 2008 anni
-114.742
+4.92
-4.11%
1 gen 2009 anni
-104.966
+9.776
-8.52%
1 gen 2010 anni
-102.297
+2.668
-2.54%
1 gen 2011 anni
-111.821
-9.523
9.31%
1 gen 2012 anni
-104.283
+7.538
-6.74%
1 gen 2013 anni
-98.577
+5.706
-5.47%
1 gen 2014 anni
-91.376
+7.201
-7.31%
Classificazione dei paesi secondo i statistiche attuali per anni


Commenti: