29
/it/
it
AIzaSyAYiBZKx7MnpbEhh9jyipgxe19OcubqV5w
April 1, 2024
182009
Luxembourg
LUX
true
2
1
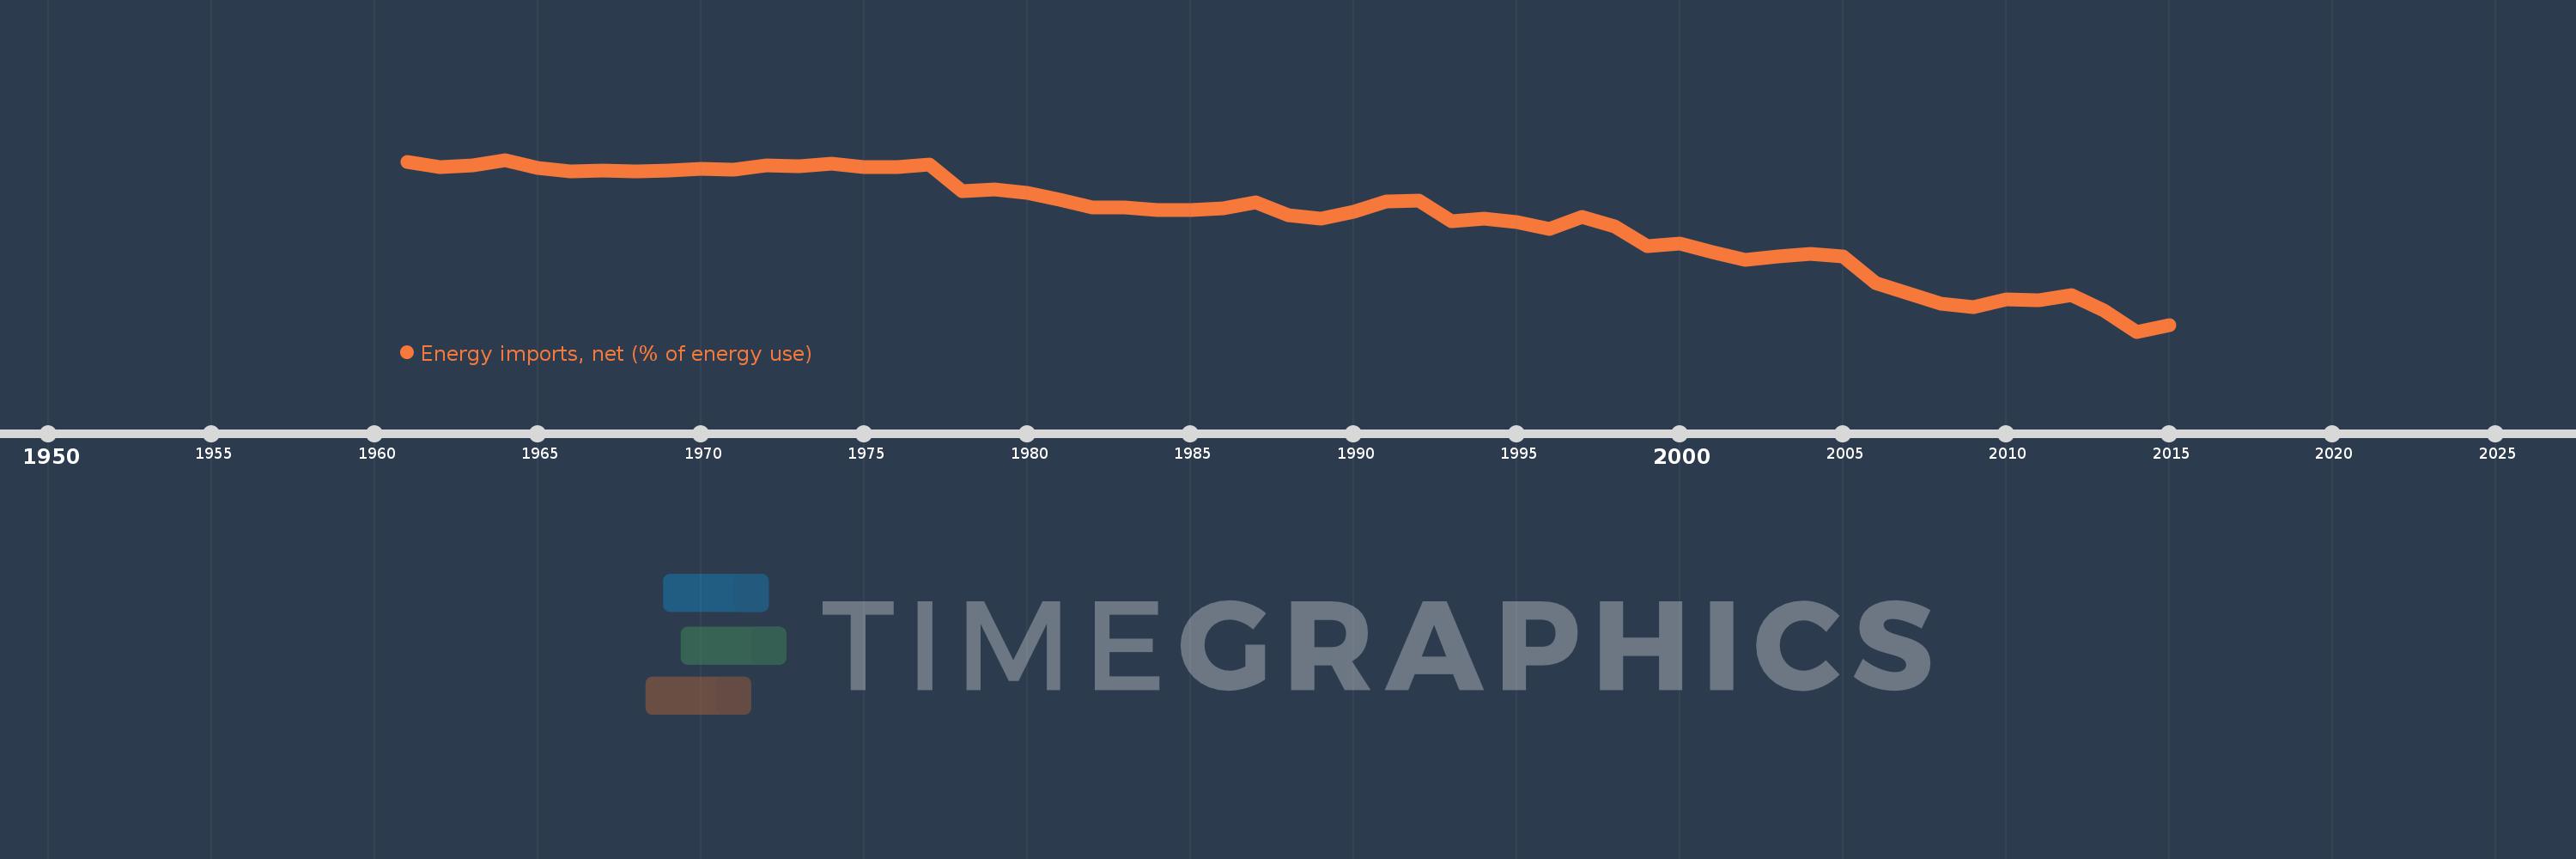
Energy imports, net (% of energy use)
2015,2014,2013,2012,2011,2010,2009,2008,2007,2006,2005,2004,2003,2002,2001,2000,1999,1998,1997,1996,1995,1994,1993,1992,1991,1990,1989,1988,1987,1986,1985,1984,1983,1982,1981,1980,1979,1978,1977,1976,1975,1974,1973,1972,1971,1970,1969,1968,1967,1966,1965,1964,1963,1962,1961
Queste statistiche in altri paesi:
AlbaniaAlgeriaAngolaArab WorldArgentinaArmeniaAustraliaAustriaAzerbaijanBahrainBangladeshBelarusBelgiumBeninBoliviaBosnia and HerzegovinaBotswanaBrazilBrunei DarussalamBulgariaCambodiaCameroonCanadaCaribbean small statesCentral Europe and the BalticsChileChinaColombiaCongo, Dem. Rep.Congo, Rep.Costa RicaCote d'IvoireCroatiaCubaCuracaoCyprusCzech RepublicDenmarkDominican RepublicEarly-demographic dividendEast Asia & PacificEast Asia & Pacific (excluding high income)East Asia & Pacific (IDA & IBRD countries)EcuadorEgypt, Arab Rep.El SalvadorEritreaEstoniaEthiopiaEuro areaEurope & Central AsiaEurope & Central Asia (excluding high income)Europe & Central Asia (IDA & IBRD countries)European UnionFinlandFragile and conflict affected situationsFranceGabonGeorgiaGermanyGhanaGibraltarGreeceGuatemalaHaitiHeavily indebted poor countries (HIPC)High incomeHondurasHong Kong SAR, ChinaHungaryIBRD onlyIcelandIDA & IBRD totalIDA blendIDA onlyIDA totalIndiaIndonesiaIran, Islamic Rep.IraqIrelandIsraelItalyJamaicaJapanJordanKazakhstanKenyaKorea, Dem. People’s Rep.Korea, Rep.KosovoKuwaitKyrgyz RepublicLate-demographic dividendLatin America & Caribbean Latin America & Caribbean (excluding high income)Latin America & the Caribbean (IDA & IBRD countries)LatviaLeast developed countries: UN classificationLebanonLibyaLithuaniaLow & middle incomeLow incomeLower middle incomeLuxembourgMacedonia, FYRMalaysiaMaltaMauritiusMexicoMiddle East & North AfricaMiddle East & North Africa (excluding high income)Middle East & North Africa (IDA & IBRD countries)Middle incomeMoldovaMongoliaMontenegroMoroccoMozambiqueMyanmarNamibiaNepalNetherlandsNew ZealandNicaraguaNigerNigeriaNorth AmericaNorwayOECD membersOmanOther small statesPakistanPanamaParaguayPeruPhilippinesPolandPortugalPost-demographic dividendPre-demographic dividendQatarRomaniaRussian FederationSaudi ArabiaSenegalSerbiaSingaporeSlovak RepublicSloveniaSmall statesSouth AfricaSouth AsiaSouth Asia (IDA & IBRD)South SudanSpainSri LankaSub-Saharan Africa Sub-Saharan Africa (excluding high income)Sub-Saharan Africa (IDA & IBRD countries)SudanSwedenSwitzerlandSyrian Arab RepublicTajikistanTanzaniaThailandTogoTrinidad and TobagoTunisiaTurkeyTurkmenistanUkraineUnited Arab EmiratesUnited KingdomUnited StatesUpper middle incomeUruguayUzbekistanVenezuela, RBVietnamWorldYemen, Rep.ZambiaZimbabwe Linea del tempo:
Questa scala temporale mostra un grafico dal 1961 anno al 2015 anno. Luxembourg. I dati fino ad 1960 anno non disponibili. Il numero di osservazioni attuali secondo i date: 55.
La fonte (nome):
Indicatori dello sviluppo mondiale
La fonte (organizzazione):
IEA Statistics © OECD/IEA 2014 (http://www.iea.org/stats/index.asp), subject to https://www.iea.org/t&c/termsandconditions/
Categorie:
Energy & Mining, Trade
sono stati aggiornati
23 apr 2017 anni
Indicatori delle variazioni dei valori per anni
Minima:
96.482
1 gen 2014 anni
Massimo:
99.995
1 gen 1964 anni
Alla data di osservazione
Valore
Variazione assoluta
La variazione rispetto al valore precedente
1 gen 1961 anni
99.948
+99.948
0.0%
1 gen 1962 anni
99.853
-0.095
-0.09%
1 gen 1963 anni
99.884
+0.031
0.03%
1 gen 1964 anni
99.995
+0.111
0.11%
1 gen 1965 anni
99.824
-0.171
-0.17%
1 gen 1966 anni
99.765
-0.059
-0.06%
1 gen 1967 anni
99.779
+0.014
0.01%
1 gen 1968 anni
99.76
-0.019
-0.02%
1 gen 1969 anni
99.774
+0.015
0.01%
1 gen 1970 anni
99.819
+0.045
0.04%
1 gen 1971 anni
99.799
-0.02
-0.02%
1 gen 1972 anni
99.884
+0.085
0.08%
1 gen 1973 anni
99.866
-0.018
-0.02%
1 gen 1974 anni
99.909
+0.043
0.04%
1 gen 1975 anni
99.846
-0.063
-0.06%
1 gen 1976 anni
99.838
-0.008
-0.01%
1 gen 1977 anni
99.897
+0.059
0.06%
1 gen 1978 anni
99.347
-0.55
-0.55%
1 gen 1979 anni
99.397
+0.051
0.05%
1 gen 1980 anni
99.312
-0.086
-0.09%
1 gen 1981 anni
99.174
-0.138
-0.14%
1 gen 1982 anni
99.028
-0.146
-0.15%
1 gen 1983 anni
99.027
-0.001
0.0%
1 gen 1984 anni
98.975
-0.052
-0.05%
1 gen 1985 anni
98.959
-0.016
-0.02%
1 gen 1986 anni
98.998
+0.039
0.04%
1 gen 1987 anni
99.132
+0.134
0.14%
1 gen 1988 anni
98.854
-0.278
-0.28%
1 gen 1989 anni
98.8
-0.054
-0.06%
1 gen 1990 anni
98.928
+0.129
0.13%
1 gen 1991 anni
99.15
+0.222
0.22%
1 gen 1992 anni
99.157
+0.007
0.01%
1 gen 1993 anni
98.745
-0.412
-0.42%
1 gen 1994 anni
98.8
+0.056
0.06%
1 gen 1995 anni
98.725
-0.075
-0.08%
1 gen 1996 anni
98.585
-0.14
-0.14%
1 gen 1997 anni
98.83
+0.245
0.25%
1 gen 1998 anni
98.633
-0.197
-0.2%
1 gen 1999 anni
98.231
-0.401
-0.41%
1 gen 2000 anni
98.29
+0.059
0.06%
1 gen 2001 anni
98.1
-0.19
-0.19%
1 gen 2002 anni
97.956
-0.144
-0.15%
1 gen 2003 anni
98.014
+0.057
0.06%
1 gen 2004 anni
98.078
+0.064
0.07%
1 gen 2005 anni
98.021
-0.057
-0.06%
1 gen 2006 anni
97.467
-0.553
-0.56%
1 gen 2007 anni
97.269
-0.198
-0.2%
1 gen 2008 anni
97.05
-0.219
-0.23%
1 gen 2009 anni
96.983
-0.067
-0.07%
1 gen 2010 anni
97.143
+0.16
0.17%
1 gen 2011 anni
97.123
-0.02
-0.02%
1 gen 2012 anni
97.223
+0.1
0.1%
1 gen 2013 anni
96.915
-0.308
-0.32%
1 gen 2014 anni
96.482
-0.433
-0.45%
1 gen 2015 anni
96.615
+0.133
0.14%
Classificazione dei paesi secondo i statistiche attuali per anni


Commenti: