29
/it/
it
AIzaSyAYiBZKx7MnpbEhh9jyipgxe19OcubqV5w
April 1, 2024
29798
Euro area
EMU
false
2
1
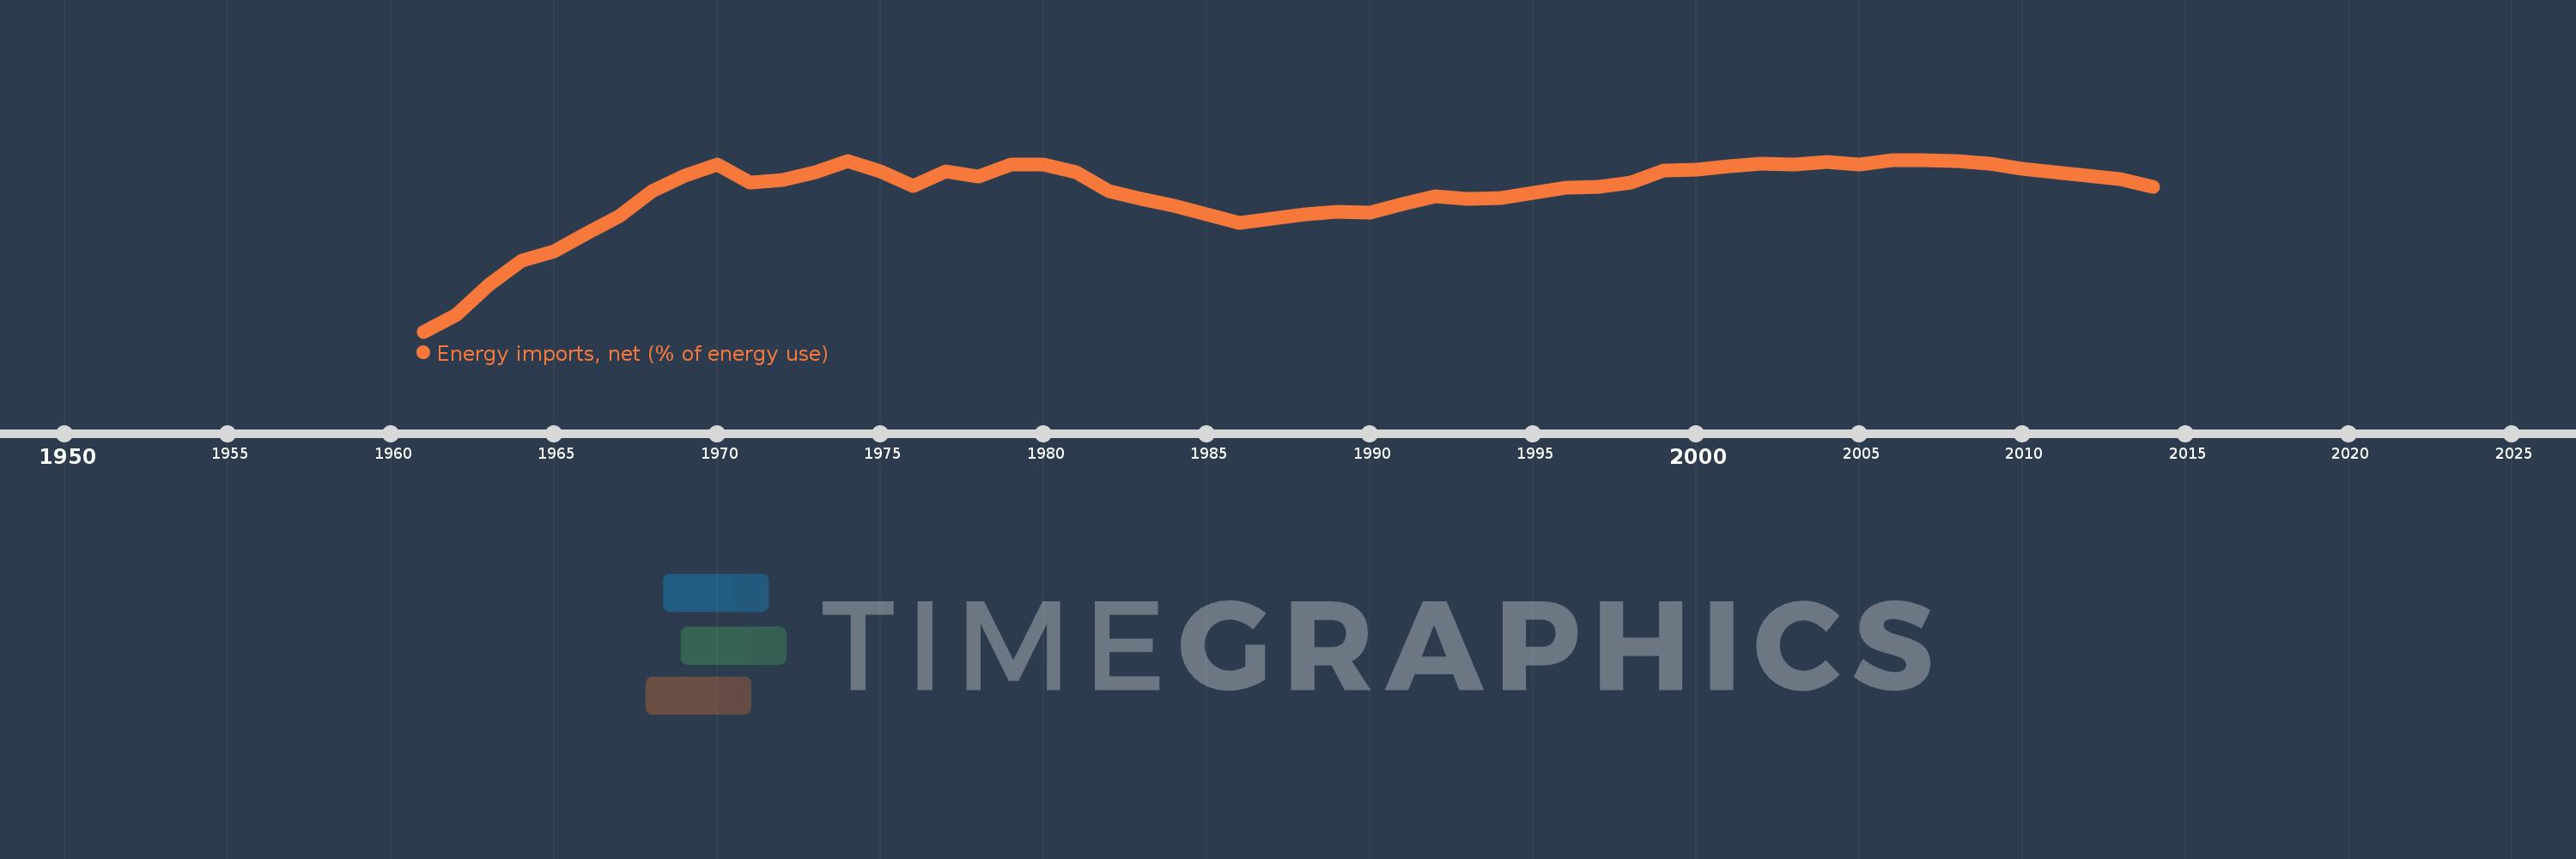
Energy imports, net (% of energy use)
2014,2013,2012,2011,2010,2009,2008,2007,2006,2005,2004,2003,2002,2001,2000,1999,1998,1997,1996,1995,1994,1993,1992,1991,1990,1989,1988,1987,1986,1985,1984,1983,1982,1981,1980,1979,1978,1977,1976,1975,1974,1973,1972,1971,1970,1969,1968,1967,1966,1965,1964,1963,1962,1961
Queste statistiche in altri paesi:
AlbaniaAlgeriaAngolaArab WorldArgentinaArmeniaAustraliaAustriaAzerbaijanBahrainBangladeshBelarusBelgiumBeninBoliviaBosnia and HerzegovinaBotswanaBrazilBrunei DarussalamBulgariaCambodiaCameroonCanadaCaribbean small statesCentral Europe and the BalticsChileChinaColombiaCongo, Dem. Rep.Congo, Rep.Costa RicaCote d'IvoireCroatiaCubaCuracaoCyprusCzech RepublicDenmarkDominican RepublicEarly-demographic dividendEast Asia & PacificEast Asia & Pacific (excluding high income)East Asia & Pacific (IDA & IBRD countries)EcuadorEgypt, Arab Rep.El SalvadorEritreaEstoniaEthiopiaEuro areaEurope & Central AsiaEurope & Central Asia (excluding high income)Europe & Central Asia (IDA & IBRD countries)European UnionFinlandFragile and conflict affected situationsFranceGabonGeorgiaGermanyGhanaGibraltarGreeceGuatemalaHaitiHeavily indebted poor countries (HIPC)High incomeHondurasHong Kong SAR, ChinaHungaryIBRD onlyIcelandIDA & IBRD totalIDA blendIDA onlyIDA totalIndiaIndonesiaIran, Islamic Rep.IraqIrelandIsraelItalyJamaicaJapanJordanKazakhstanKenyaKorea, Dem. People’s Rep.Korea, Rep.KosovoKuwaitKyrgyz RepublicLate-demographic dividendLatin America & Caribbean Latin America & Caribbean (excluding high income)Latin America & the Caribbean (IDA & IBRD countries)LatviaLeast developed countries: UN classificationLebanonLibyaLithuaniaLow & middle incomeLow incomeLower middle incomeLuxembourgMacedonia, FYRMalaysiaMaltaMauritiusMexicoMiddle East & North AfricaMiddle East & North Africa (excluding high income)Middle East & North Africa (IDA & IBRD countries)Middle incomeMoldovaMongoliaMontenegroMoroccoMozambiqueMyanmarNamibiaNepalNetherlandsNew ZealandNicaraguaNigerNigeriaNorth AmericaNorwayOECD membersOmanOther small statesPakistanPanamaParaguayPeruPhilippinesPolandPortugalPost-demographic dividendPre-demographic dividendQatarRomaniaRussian FederationSaudi ArabiaSenegalSerbiaSingaporeSlovak RepublicSloveniaSmall statesSouth AfricaSouth AsiaSouth Asia (IDA & IBRD)South SudanSpainSri LankaSub-Saharan Africa Sub-Saharan Africa (excluding high income)Sub-Saharan Africa (IDA & IBRD countries)SudanSwedenSwitzerlandSyrian Arab RepublicTajikistanTanzaniaThailandTogoTrinidad and TobagoTunisiaTurkeyTurkmenistanUkraineUnited Arab EmiratesUnited KingdomUnited StatesUpper middle incomeUruguayUzbekistanVenezuela, RBVietnamWorldYemen, Rep.ZambiaZimbabwe Linea del tempo:
Questa scala temporale mostra un grafico dal 1961 anno al 2014 anno. Euro area. I dati fino ad 1960 anno non disponibili. Il numero di osservazioni attuali secondo i date: 54.
La fonte (nome):
Indicatori dello sviluppo mondiale
La fonte (organizzazione):
IEA Statistics © OECD/IEA 2014 (http://www.iea.org/stats/index.asp), subject to https://www.iea.org/t&c/termsandconditions/
Categorie:
Energy & Mining, Trade
sono stati aggiornati
23 apr 2017 anni
Indicatori delle variazioni dei valori per anni
Minima:
33.985
1 gen 1961 anni
Massimo:
62.754
1 gen 2006 anni
Alla data di osservazione
Valore
Variazione assoluta
La variazione rispetto al valore precedente
1 gen 1961 anni
33.985
+33.985
0.0%
1 gen 1962 anni
36.834
+2.849
8.38%
1 gen 1963 anni
41.867
+5.033
13.66%
1 gen 1964 anni
45.881
+4.013
9.59%
1 gen 1965 anni
47.402
+1.522
3.32%
1 gen 1966 anni
50.424
+3.022
6.37%
1 gen 1967 anni
53.292
+2.867
5.69%
1 gen 1968 anni
57.511
+4.219
7.92%
1 gen 1969 anni
60.141
+2.63
4.57%
1 gen 1970 anni
61.943
+1.802
3.0%
1 gen 1971 anni
58.995
-2.948
-4.76%
1 gen 1972 anni
59.365
+0.37
0.63%
1 gen 1973 anni
60.612
+1.247
2.1%
1 gen 1974 anni
62.489
+1.877
3.1%
1 gen 1975 anni
60.779
-1.71
-2.74%
1 gen 1976 anni
58.39
-2.389
-3.93%
1 gen 1977 anni
60.841
+2.451
4.2%
1 gen 1978 anni
59.919
-0.922
-1.51%
1 gen 1979 anni
61.944
+2.025
3.38%
1 gen 1980 anni
61.993
+0.049
0.08%
1 gen 1981 anni
60.698
-1.295
-2.09%
1 gen 1982 anni
57.473
-3.226
-5.31%
1 gen 1983 anni
56.202
-1.271
-2.21%
1 gen 1984 anni
55.051
-1.151
-2.05%
1 gen 1985 anni
53.596
-1.455
-2.64%
1 gen 1986 anni
52.251
-1.344
-2.51%
1 gen 1987 anni
52.868
+0.617
1.18%
1 gen 1988 anni
53.672
+0.803
1.52%
1 gen 1989 anni
54.039
+0.367
0.68%
1 gen 1990 anni
53.848
-0.191
-0.35%
1 gen 1991 anni
55.393
+1.544
2.87%
1 gen 1992 anni
56.696
+1.303
2.35%
1 gen 1993 anni
56.184
-0.512
-0.9%
1 gen 1994 anni
56.325
+0.142
0.25%
1 gen 1995 anni
57.217
+0.891
1.58%
1 gen 1996 anni
58.052
+0.835
1.46%
1 gen 1997 anni
58.175
+0.123
0.21%
1 gen 1998 anni
59.004
+0.83
1.43%
1 gen 1999 anni
60.95
+1.946
3.3%
1 gen 2000 anni
61.116
+0.166
0.27%
1 gen 2001 anni
61.627
+0.51
0.84%
1 gen 2002 anni
62.093
+0.466
0.76%
1 gen 2003 anni
61.913
-0.179
-0.29%
1 gen 2004 anni
62.406
+0.492
0.8%
1 gen 2005 anni
61.978
-0.428
-0.69%
1 gen 2006 anni
62.754
+0.776
1.25%
1 gen 2007 anni
62.64
-0.114
-0.18%
1 gen 2008 anni
62.548
-0.092
-0.15%
1 gen 2009 anni
62.064
-0.483
-0.77%
1 gen 2010 anni
61.207
-0.857
-1.38%
1 gen 2011 anni
60.633
-0.574
-0.94%
1 gen 2012 anni
60.116
-0.517
-0.85%
1 gen 2013 anni
59.471
-0.646
-1.07%
1 gen 2014 anni
58.262
-1.208
-2.03%
Classificazione dei paesi secondo i statistiche attuali per anni


Commenti: