29
/it/
it
AIzaSyAYiBZKx7MnpbEhh9jyipgxe19OcubqV5w
April 1, 2024
49863
Middle East & North Africa (IDA & IBRD countries)
TMN
false
2
1
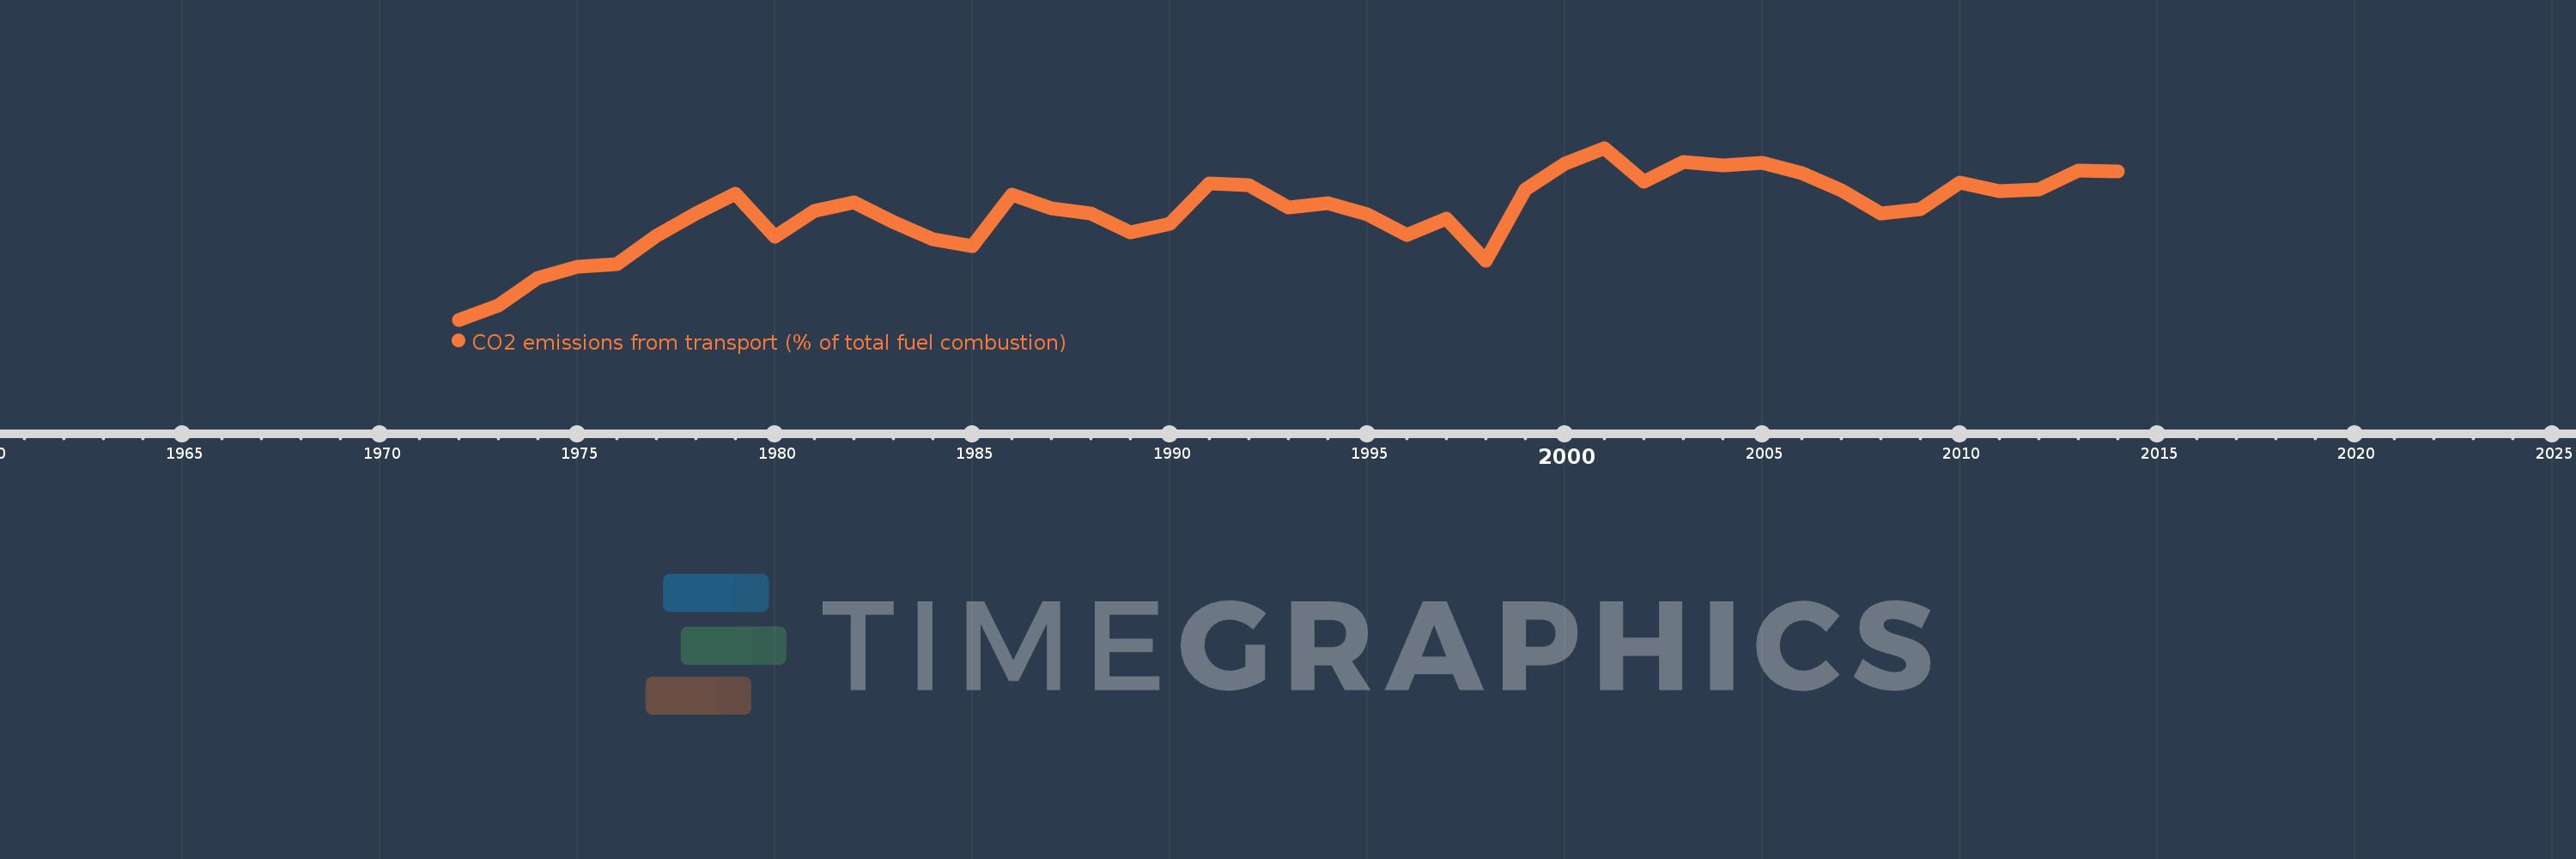
CO2 emissions from transport (% of total fuel combustion)
2014,2013,2012,2011,2010,2009,2008,2007,2006,2005,2004,2003,2002,2001,2000,1999,1998,1997,1996,1995,1994,1993,1992,1991,1990,1989,1988,1987,1986,1985,1984,1983,1982,1981,1980,1979,1978,1977,1976,1975,1974,1973,1972
Queste statistiche in altri paesi:
AlbaniaAlgeriaAngolaArab WorldArgentinaArmeniaAustraliaAustriaAzerbaijanBahrainBangladeshBelarusBelgiumBeninBoliviaBosnia and HerzegovinaBotswanaBrazilBrunei DarussalamBulgariaCambodiaCameroonCanadaCaribbean small statesCentral Europe and the BalticsChileChinaColombiaCongo, Dem. Rep.Congo, Rep.Costa RicaCote d'IvoireCroatiaCubaCuracaoCyprusCzech RepublicDenmarkDominican RepublicEarly-demographic dividendEast Asia & PacificEast Asia & Pacific (excluding high income)East Asia & Pacific (IDA & IBRD countries)EcuadorEgypt, Arab Rep.El SalvadorEritreaEstoniaEthiopiaEuro areaEurope & Central AsiaEurope & Central Asia (excluding high income)Europe & Central Asia (IDA & IBRD countries)European UnionFinlandFragile and conflict affected situationsFranceGabonGeorgiaGermanyGhanaGibraltarGreeceGuatemalaHaitiHeavily indebted poor countries (HIPC)High incomeHondurasHong Kong SAR, ChinaHungaryIBRD onlyIcelandIDA & IBRD totalIDA blendIDA onlyIDA totalIndiaIndonesiaIran, Islamic Rep.IraqIrelandIsraelItalyJamaicaJapanJordanKazakhstanKenyaKorea, Dem. People’s Rep.Korea, Rep.KosovoKuwaitKyrgyz RepublicLate-demographic dividendLatin America & Caribbean Latin America & Caribbean (excluding high income)Latin America & the Caribbean (IDA & IBRD countries)LatviaLeast developed countries: UN classificationLebanonLibyaLithuaniaLow & middle incomeLow incomeLower middle incomeLuxembourgMacedonia, FYRMalaysiaMaltaMauritiusMexicoMiddle East & North AfricaMiddle East & North Africa (excluding high income)Middle East & North Africa (IDA & IBRD countries)Middle incomeMoldovaMongoliaMontenegroMoroccoMozambiqueMyanmarNamibiaNepalNetherlandsNew ZealandNicaraguaNigerNigeriaNorth AmericaNorwayOECD membersOmanOther small statesPakistanPanamaParaguayPeruPhilippinesPolandPortugalPost-demographic dividendPre-demographic dividendQatarRomaniaRussian FederationSaudi ArabiaSenegalSerbiaSingaporeSlovak RepublicSloveniaSmall statesSouth AfricaSouth AsiaSouth Asia (IDA & IBRD)South SudanSpainSri LankaSub-Saharan Africa Sub-Saharan Africa (excluding high income)Sub-Saharan Africa (IDA & IBRD countries)SudanSwedenSwitzerlandSyrian Arab RepublicTajikistanTanzaniaThailandTogoTrinidad and TobagoTunisiaTurkeyTurkmenistanUkraineUnited Arab EmiratesUnited KingdomUnited StatesUpper middle incomeUruguayUzbekistanVenezuela, RBVietnamWorldYemen, Rep.ZambiaZimbabwe Linea del tempo:
Questa scala temporale mostra un grafico dal 1972 anno al 2014 anno. Middle East & North Africa (IDA & IBRD countries). I dati fino ad 1971 anno non disponibili. Il numero di osservazioni attuali secondo i date: 43.
La fonte (nome):
Indicatori dello sviluppo mondiale
La fonte (organizzazione):
IEA Statistics © OECD/IEA 2014 (http://www.iea.org/stats/index.asp), subject to https://www.iea.org/t&c/termsandconditions/
Categorie:
Environment
sono stati aggiornati
23 apr 2017 anni
Indicatori delle variazioni dei valori per anni
Minima:
22.804
1 gen 1972 anni
Massimo:
27.284
1 gen 2001 anni
Alla data di osservazione
Valore
Variazione assoluta
La variazione rispetto al valore precedente
1 gen 1972 anni
22.804
+22.804
0.0%
1 gen 1973 anni
23.176
+0.372
1.63%
1 gen 1974 anni
23.902
+0.726
3.13%
1 gen 1975 anni
24.181
+0.278
1.16%
1 gen 1976 anni
24.246
+0.065
0.27%
1 gen 1977 anni
24.987
+0.741
3.06%
1 gen 1978 anni
25.572
+0.585
2.34%
1 gen 1979 anni
26.09
+0.518
2.03%
1 gen 1980 anni
24.959
-1.131
-4.33%
1 gen 1981 anni
25.644
+0.685
2.74%
1 gen 1982 anni
25.859
+0.215
0.84%
1 gen 1983 anni
25.341
-0.517
-2.0%
1 gen 1984 anni
24.892
-0.45
-1.77%
1 gen 1985 anni
24.731
-0.16
-0.64%
1 gen 1986 anni
26.076
+1.344
5.44%
1 gen 1987 anni
25.702
-0.374
-1.43%
1 gen 1988 anni
25.567
-0.135
-0.52%
1 gen 1989 anni
25.087
-0.48
-1.88%
1 gen 1990 anni
25.312
+0.225
0.9%
1 gen 1991 anni
26.353
+1.041
4.11%
1 gen 1992 anni
26.305
-0.049
-0.19%
1 gen 1993 anni
25.725
-0.58
-2.2%
1 gen 1994 anni
25.848
+0.123
0.48%
1 gen 1995 anni
25.542
-0.306
-1.18%
1 gen 1996 anni
25.011
-0.531
-2.08%
1 gen 1997 anni
25.439
+0.428
1.71%
1 gen 1998 anni
24.34
-1.099
-4.32%
1 gen 1999 anni
26.206
+1.866
7.67%
1 gen 2000 anni
26.869
+0.663
2.53%
1 gen 2001 anni
27.284
+0.415
1.55%
1 gen 2002 anni
26.408
-0.876
-3.21%
1 gen 2003 anni
26.929
+0.521
1.97%
1 gen 2004 anni
26.825
-0.105
-0.39%
1 gen 2005 anni
26.889
+0.065
0.24%
1 gen 2006 anni
26.631
-0.259
-0.96%
1 gen 2007 anni
26.181
-0.45
-1.69%
1 gen 2008 anni
25.584
-0.597
-2.28%
1 gen 2009 anni
25.685
+0.102
0.4%
1 gen 2010 anni
26.373
+0.687
2.68%
1 gen 2011 anni
26.156
-0.216
-0.82%
1 gen 2012 anni
26.198
+0.041
0.16%
1 gen 2013 anni
26.69
+0.493
1.88%
1 gen 2014 anni
26.681
-0.009
-0.03%
Classificazione dei paesi secondo i statistiche attuali per anni


Commenti: