29
/it/
it
AIzaSyAYiBZKx7MnpbEhh9jyipgxe19OcubqV5w
April 1, 2024
228237
Romania
ROU
true
2
1
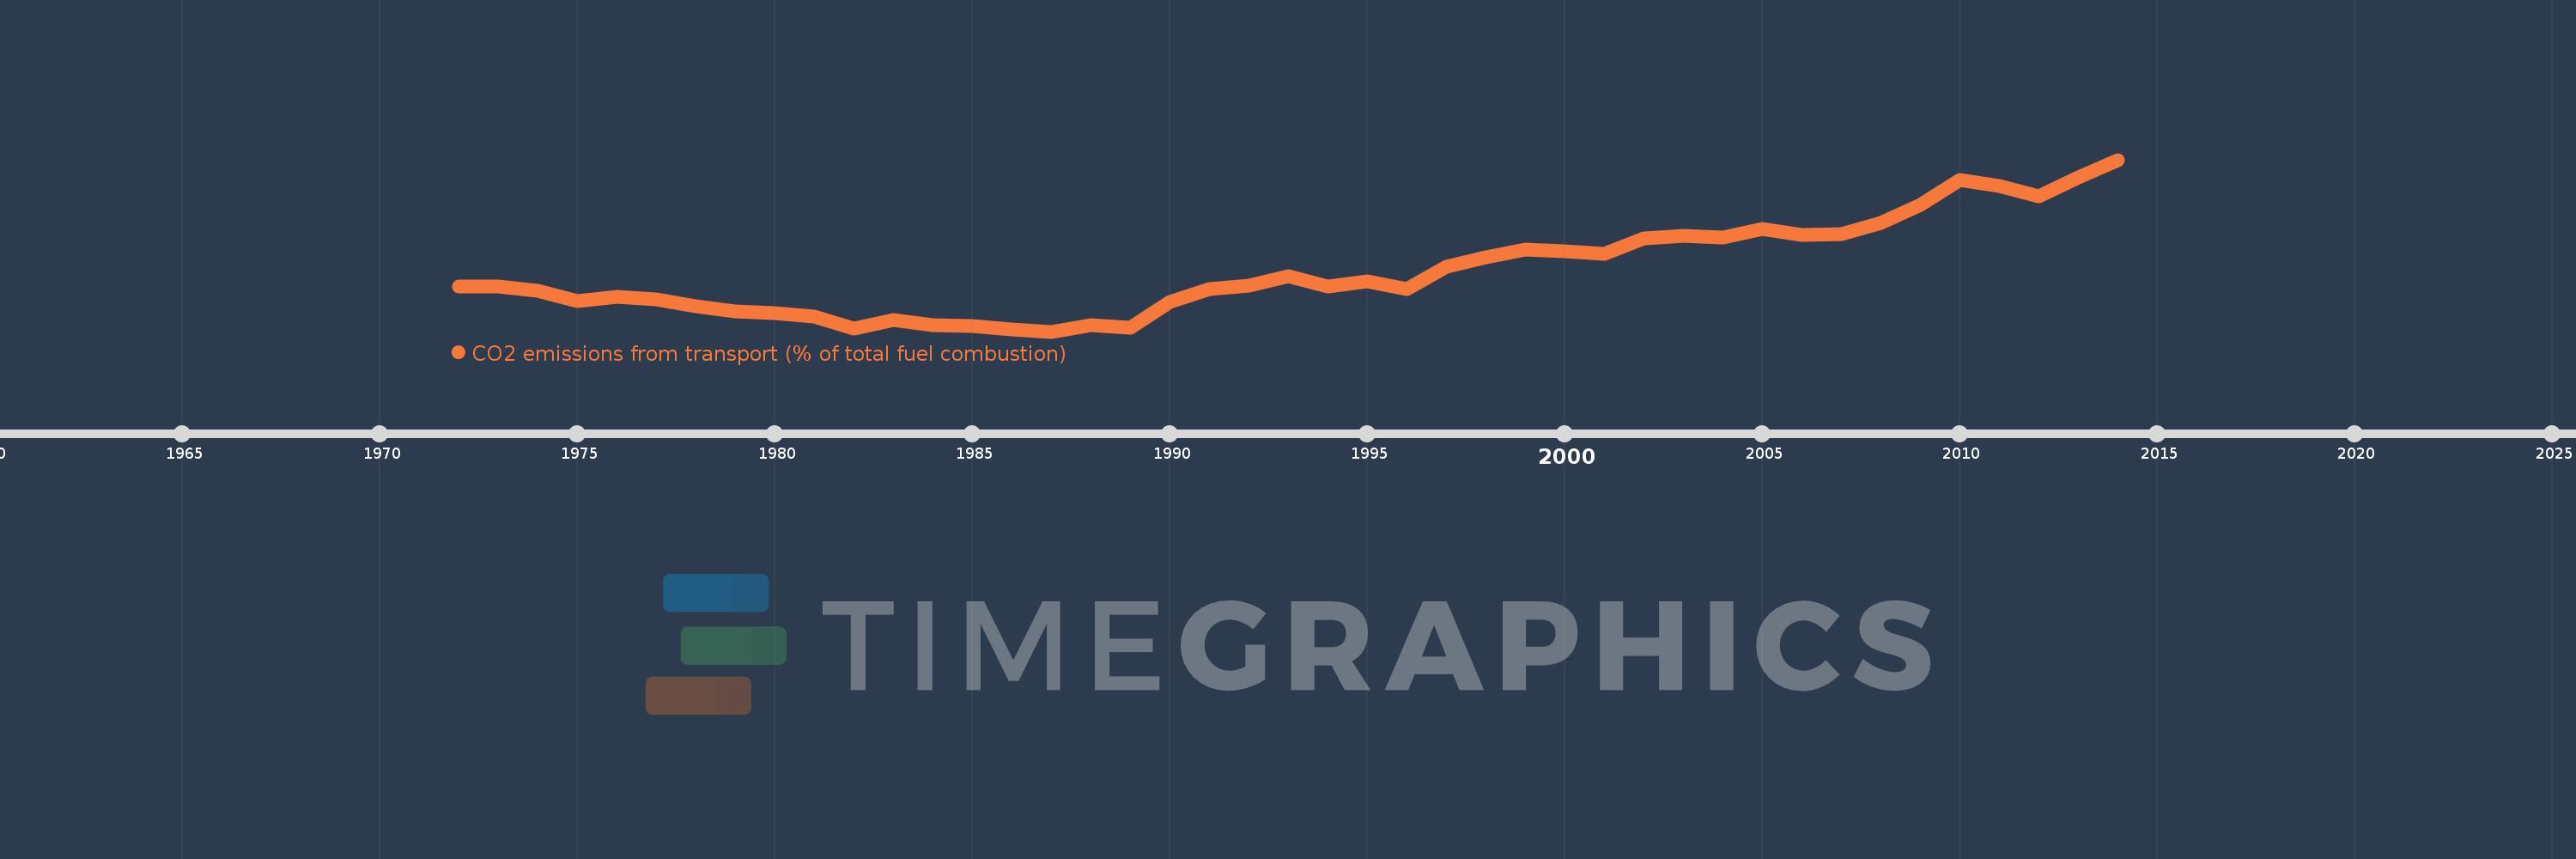
CO2 emissions from transport (% of total fuel combustion)
2014,2013,2012,2011,2010,2009,2008,2007,2006,2005,2004,2003,2002,2001,2000,1999,1998,1997,1996,1995,1994,1993,1992,1991,1990,1989,1988,1987,1986,1985,1984,1983,1982,1981,1980,1979,1978,1977,1976,1975,1974,1973,1972
Queste statistiche in altri paesi:
AlbaniaAlgeriaAngolaArab WorldArgentinaArmeniaAustraliaAustriaAzerbaijanBahrainBangladeshBelarusBelgiumBeninBoliviaBosnia and HerzegovinaBotswanaBrazilBrunei DarussalamBulgariaCambodiaCameroonCanadaCaribbean small statesCentral Europe and the BalticsChileChinaColombiaCongo, Dem. Rep.Congo, Rep.Costa RicaCote d'IvoireCroatiaCubaCuracaoCyprusCzech RepublicDenmarkDominican RepublicEarly-demographic dividendEast Asia & PacificEast Asia & Pacific (excluding high income)East Asia & Pacific (IDA & IBRD countries)EcuadorEgypt, Arab Rep.El SalvadorEritreaEstoniaEthiopiaEuro areaEurope & Central AsiaEurope & Central Asia (excluding high income)Europe & Central Asia (IDA & IBRD countries)European UnionFinlandFragile and conflict affected situationsFranceGabonGeorgiaGermanyGhanaGibraltarGreeceGuatemalaHaitiHeavily indebted poor countries (HIPC)High incomeHondurasHong Kong SAR, ChinaHungaryIBRD onlyIcelandIDA & IBRD totalIDA blendIDA onlyIDA totalIndiaIndonesiaIran, Islamic Rep.IraqIrelandIsraelItalyJamaicaJapanJordanKazakhstanKenyaKorea, Dem. People’s Rep.Korea, Rep.KosovoKuwaitKyrgyz RepublicLate-demographic dividendLatin America & Caribbean Latin America & Caribbean (excluding high income)Latin America & the Caribbean (IDA & IBRD countries)LatviaLeast developed countries: UN classificationLebanonLibyaLithuaniaLow & middle incomeLow incomeLower middle incomeLuxembourgMacedonia, FYRMalaysiaMaltaMauritiusMexicoMiddle East & North AfricaMiddle East & North Africa (excluding high income)Middle East & North Africa (IDA & IBRD countries)Middle incomeMoldovaMongoliaMontenegroMoroccoMozambiqueMyanmarNamibiaNepalNetherlandsNew ZealandNicaraguaNigerNigeriaNorth AmericaNorwayOECD membersOmanOther small statesPakistanPanamaParaguayPeruPhilippinesPolandPortugalPost-demographic dividendPre-demographic dividendQatarRomaniaRussian FederationSaudi ArabiaSenegalSerbiaSingaporeSlovak RepublicSloveniaSmall statesSouth AfricaSouth AsiaSouth Asia (IDA & IBRD)South SudanSpainSri LankaSub-Saharan Africa Sub-Saharan Africa (excluding high income)Sub-Saharan Africa (IDA & IBRD countries)SudanSwedenSwitzerlandSyrian Arab RepublicTajikistanTanzaniaThailandTogoTrinidad and TobagoTunisiaTurkeyTurkmenistanUkraineUnited Arab EmiratesUnited KingdomUnited StatesUpper middle incomeUruguayUzbekistanVenezuela, RBVietnamWorldYemen, Rep.ZambiaZimbabwe Linea del tempo:
Questa scala temporale mostra un grafico dal 1972 anno al 2014 anno. Romania. I dati fino ad 1971 anno non disponibili. Il numero di osservazioni attuali secondo i date: 43.
La fonte (nome):
Indicatori dello sviluppo mondiale
La fonte (organizzazione):
IEA Statistics © OECD/IEA 2014 (http://www.iea.org/stats/index.asp), subject to https://www.iea.org/t&c/termsandconditions/
Categorie:
Environment
sono stati aggiornati
23 apr 2017 anni
Indicatori delle variazioni dei valori per anni
Minima:
2.217
1 gen 1987 anni
Massimo:
21.47
1 gen 2014 anni
Alla data di osservazione
Valore
Variazione assoluta
La variazione rispetto al valore precedente
1 gen 1972 anni
7.248
+7.248
0.0%
1 gen 1973 anni
7.252
+0.003
0.05%
1 gen 1974 anni
6.77
-0.481
-6.63%
1 gen 1975 anni
5.641
-1.13
-16.69%
1 gen 1976 anni
6.154
+0.513
9.09%
1 gen 1977 anni
5.857
-0.296
-4.81%
1 gen 1978 anni
5.084
-0.774
-13.21%
1 gen 1979 anni
4.514
-0.57
-11.2%
1 gen 1980 anni
4.275
-0.239
-5.3%
1 gen 1981 anni
3.885
-0.39
-9.11%
1 gen 1982 anni
2.507
-1.378
-35.47%
1 gen 1983 anni
3.491
+0.984
39.24%
1 gen 1984 anni
2.949
-0.542
-15.53%
1 gen 1985 anni
2.887
-0.062
-2.09%
1 gen 1986 anni
2.448
-0.44
-15.23%
1 gen 1987 anni
2.217
-0.231
-9.43%
1 gen 1988 anni
2.939
+0.722
32.57%
1 gen 1989 anni
2.673
-0.266
-9.04%
1 gen 1990 anni
5.583
+2.91
108.87%
1 gen 1991 anni
6.969
+1.386
24.83%
1 gen 1992 anni
7.361
+0.392
5.62%
1 gen 1993 anni
8.418
+1.057
14.36%
1 gen 1994 anni
7.262
-1.156
-13.74%
1 gen 1995 anni
7.885
+0.624
8.59%
1 gen 1996 anni
6.938
-0.948
-12.02%
1 gen 1997 anni
9.488
+2.55
36.76%
1 gen 1998 anni
10.577
+1.089
11.48%
1 gen 1999 anni
11.453
+0.876
8.29%
1 gen 2000 anni
11.222
-0.231
-2.01%
1 gen 2001 anni
10.958
-0.265
-2.36%
1 gen 2002 anni
12.642
+1.685
15.37%
1 gen 2003 anni
12.956
+0.314
2.48%
1 gen 2004 anni
12.804
-0.152
-1.18%
1 gen 2005 anni
13.737
+0.933
7.29%
1 gen 2006 anni
13.015
-0.722
-5.25%
1 gen 2007 anni
13.135
+0.119
0.92%
1 gen 2008 anni
14.381
+1.247
9.49%
1 gen 2009 anni
16.405
+2.024
14.07%
1 gen 2010 anni
19.169
+2.763
16.84%
1 gen 2011 anni
18.486
-0.683
-3.56%
1 gen 2012 anni
17.355
-1.131
-6.12%
1 gen 2013 anni
19.501
+2.147
12.37%
1 gen 2014 anni
21.47
+1.969
10.1%
Classificazione dei paesi secondo i statistiche attuali per anni


Commenti: