29
/it/
it
AIzaSyAYiBZKx7MnpbEhh9jyipgxe19OcubqV5w
April 1, 2024
104667
Chile
CHL
true
2
1
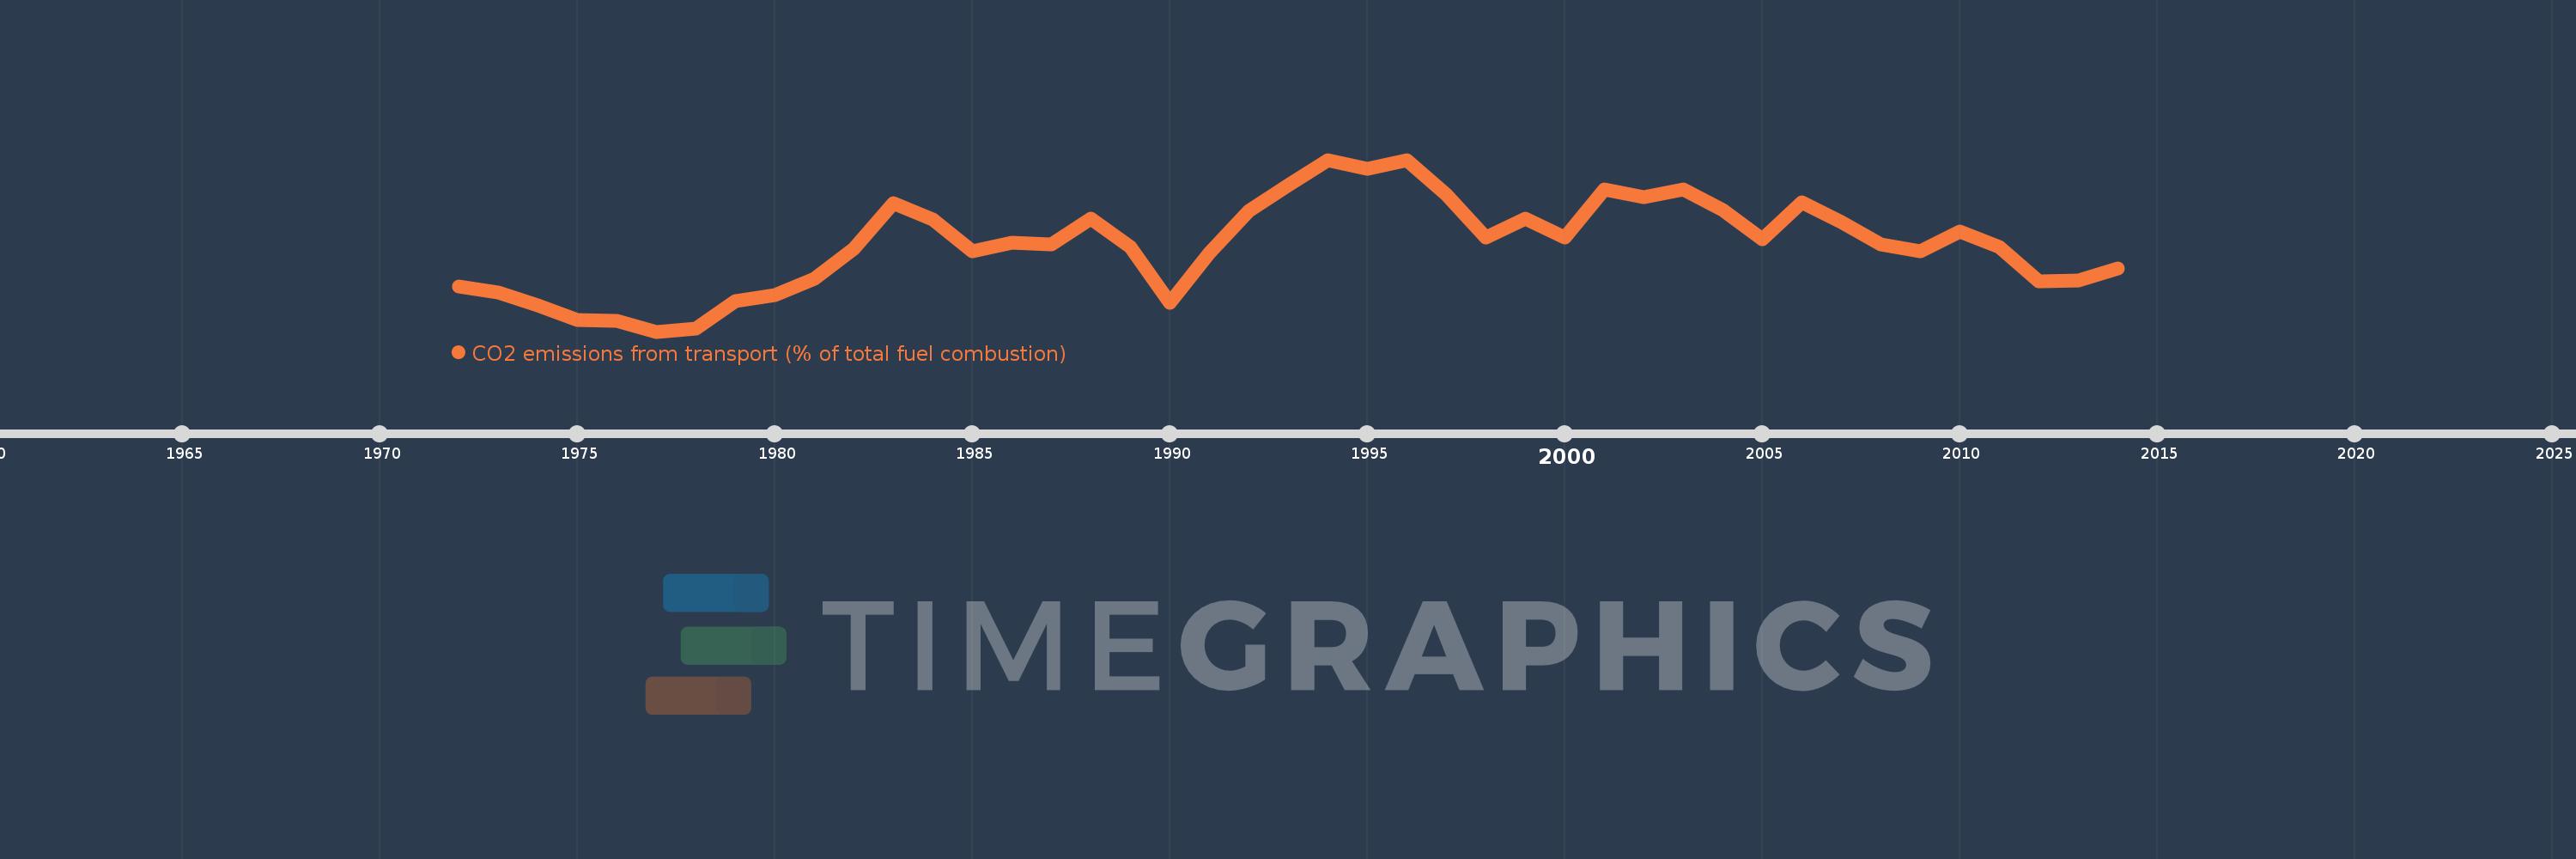
CO2 emissions from transport (% of total fuel combustion)
2014,2013,2012,2011,2010,2009,2008,2007,2006,2005,2004,2003,2002,2001,2000,1999,1998,1997,1996,1995,1994,1993,1992,1991,1990,1989,1988,1987,1986,1985,1984,1983,1982,1981,1980,1979,1978,1977,1976,1975,1974,1973,1972
Queste statistiche in altri paesi:
AlbaniaAlgeriaAngolaArab WorldArgentinaArmeniaAustraliaAustriaAzerbaijanBahrainBangladeshBelarusBelgiumBeninBoliviaBosnia and HerzegovinaBotswanaBrazilBrunei DarussalamBulgariaCambodiaCameroonCanadaCaribbean small statesCentral Europe and the BalticsChileChinaColombiaCongo, Dem. Rep.Congo, Rep.Costa RicaCote d'IvoireCroatiaCubaCuracaoCyprusCzech RepublicDenmarkDominican RepublicEarly-demographic dividendEast Asia & PacificEast Asia & Pacific (excluding high income)East Asia & Pacific (IDA & IBRD countries)EcuadorEgypt, Arab Rep.El SalvadorEritreaEstoniaEthiopiaEuro areaEurope & Central AsiaEurope & Central Asia (excluding high income)Europe & Central Asia (IDA & IBRD countries)European UnionFinlandFragile and conflict affected situationsFranceGabonGeorgiaGermanyGhanaGibraltarGreeceGuatemalaHaitiHeavily indebted poor countries (HIPC)High incomeHondurasHong Kong SAR, ChinaHungaryIBRD onlyIcelandIDA & IBRD totalIDA blendIDA onlyIDA totalIndiaIndonesiaIran, Islamic Rep.IraqIrelandIsraelItalyJamaicaJapanJordanKazakhstanKenyaKorea, Dem. People’s Rep.Korea, Rep.KosovoKuwaitKyrgyz RepublicLate-demographic dividendLatin America & Caribbean Latin America & Caribbean (excluding high income)Latin America & the Caribbean (IDA & IBRD countries)LatviaLeast developed countries: UN classificationLebanonLibyaLithuaniaLow & middle incomeLow incomeLower middle incomeLuxembourgMacedonia, FYRMalaysiaMaltaMauritiusMexicoMiddle East & North AfricaMiddle East & North Africa (excluding high income)Middle East & North Africa (IDA & IBRD countries)Middle incomeMoldovaMongoliaMontenegroMoroccoMozambiqueMyanmarNamibiaNepalNetherlandsNew ZealandNicaraguaNigerNigeriaNorth AmericaNorwayOECD membersOmanOther small statesPakistanPanamaParaguayPeruPhilippinesPolandPortugalPost-demographic dividendPre-demographic dividendQatarRomaniaRussian FederationSaudi ArabiaSenegalSerbiaSingaporeSlovak RepublicSloveniaSmall statesSouth AfricaSouth AsiaSouth Asia (IDA & IBRD)South SudanSpainSri LankaSub-Saharan Africa Sub-Saharan Africa (excluding high income)Sub-Saharan Africa (IDA & IBRD countries)SudanSwedenSwitzerlandSyrian Arab RepublicTajikistanTanzaniaThailandTogoTrinidad and TobagoTunisiaTurkeyTurkmenistanUkraineUnited Arab EmiratesUnited KingdomUnited StatesUpper middle incomeUruguayUzbekistanVenezuela, RBVietnamWorldYemen, Rep.ZambiaZimbabwe Linea del tempo:
Questa scala temporale mostra un grafico dal 1972 anno al 2014 anno. Chile. I dati fino ad 1971 anno non disponibili. Il numero di osservazioni attuali secondo i date: 43.
La fonte (nome):
Indicatori dello sviluppo mondiale
La fonte (organizzazione):
IEA Statistics © OECD/IEA 2014 (http://www.iea.org/stats/index.asp), subject to https://www.iea.org/t&c/termsandconditions/
Categorie:
Environment
sono stati aggiornati
23 apr 2017 anni
Indicatori delle variazioni dei valori per anni
Minima:
25.769
1 gen 1977 anni
Massimo:
36.854
1 gen 1994 anni
Alla data di osservazione
Valore
Variazione assoluta
La variazione rispetto al valore precedente
1 gen 1972 anni
28.673
+28.673
0.0%
1 gen 1973 anni
28.295
-0.379
-1.32%
1 gen 1974 anni
27.45
-0.845
-2.98%
1 gen 1975 anni
26.497
-0.953
-3.47%
1 gen 1976 anni
26.476
-0.022
-0.08%
1 gen 1977 anni
25.769
-0.707
-2.67%
1 gen 1978 anni
25.978
+0.209
0.81%
1 gen 1979 anni
27.709
+1.731
6.67%
1 gen 1980 anni
28.128
+0.419
1.51%
1 gen 1981 anni
29.159
+1.031
3.66%
1 gen 1982 anni
31.094
+1.936
6.64%
1 gen 1983 anni
34.059
+2.964
9.53%
1 gen 1984 anni
32.983
-1.076
-3.16%
1 gen 1985 anni
30.925
-2.057
-6.24%
1 gen 1986 anni
31.498
+0.573
1.85%
1 gen 1987 anni
31.405
-0.094
-0.3%
1 gen 1988 anni
33.073
+1.669
5.31%
1 gen 1989 anni
31.21
-1.863
-5.63%
1 gen 1990 anni
27.633
-3.576
-11.46%
1 gen 1991 anni
30.853
+3.22
11.65%
1 gen 1992 anni
33.546
+2.693
8.73%
1 gen 1993 anni
35.24
+1.694
5.05%
1 gen 1994 anni
36.854
+1.614
4.58%
1 gen 1995 anni
36.275
-0.579
-1.57%
1 gen 1996 anni
36.805
+0.53
1.46%
1 gen 1997 anni
34.592
-2.213
-6.01%
1 gen 1998 anni
31.829
-2.763
-7.99%
1 gen 1999 anni
33.047
+1.218
3.83%
1 gen 2000 anni
31.813
-1.234
-3.73%
1 gen 2001 anni
34.931
+3.118
9.8%
1 gen 2002 anni
34.419
-0.512
-1.47%
1 gen 2003 anni
34.95
+0.531
1.54%
1 gen 2004 anni
33.601
-1.35
-3.86%
1 gen 2005 anni
31.708
-1.893
-5.63%
1 gen 2006 anni
34.105
+2.397
7.56%
1 gen 2007 anni
32.842
-1.263
-3.7%
1 gen 2008 anni
31.415
-1.428
-4.35%
1 gen 2009 anni
30.943
-0.472
-1.5%
1 gen 2010 anni
32.248
+1.305
4.22%
1 gen 2011 anni
31.244
-1.004
-3.11%
1 gen 2012 anni
29.017
-2.226
-7.13%
1 gen 2013 anni
29.047
+0.03
0.1%
1 gen 2014 anni
29.862
+0.815
2.81%
Classificazione dei paesi secondo i statistiche attuali per anni


Commenti: