29
/it/
it
AIzaSyAYiBZKx7MnpbEhh9jyipgxe19OcubqV5w
April 1, 2024
133919
France
FRA
true
2
1
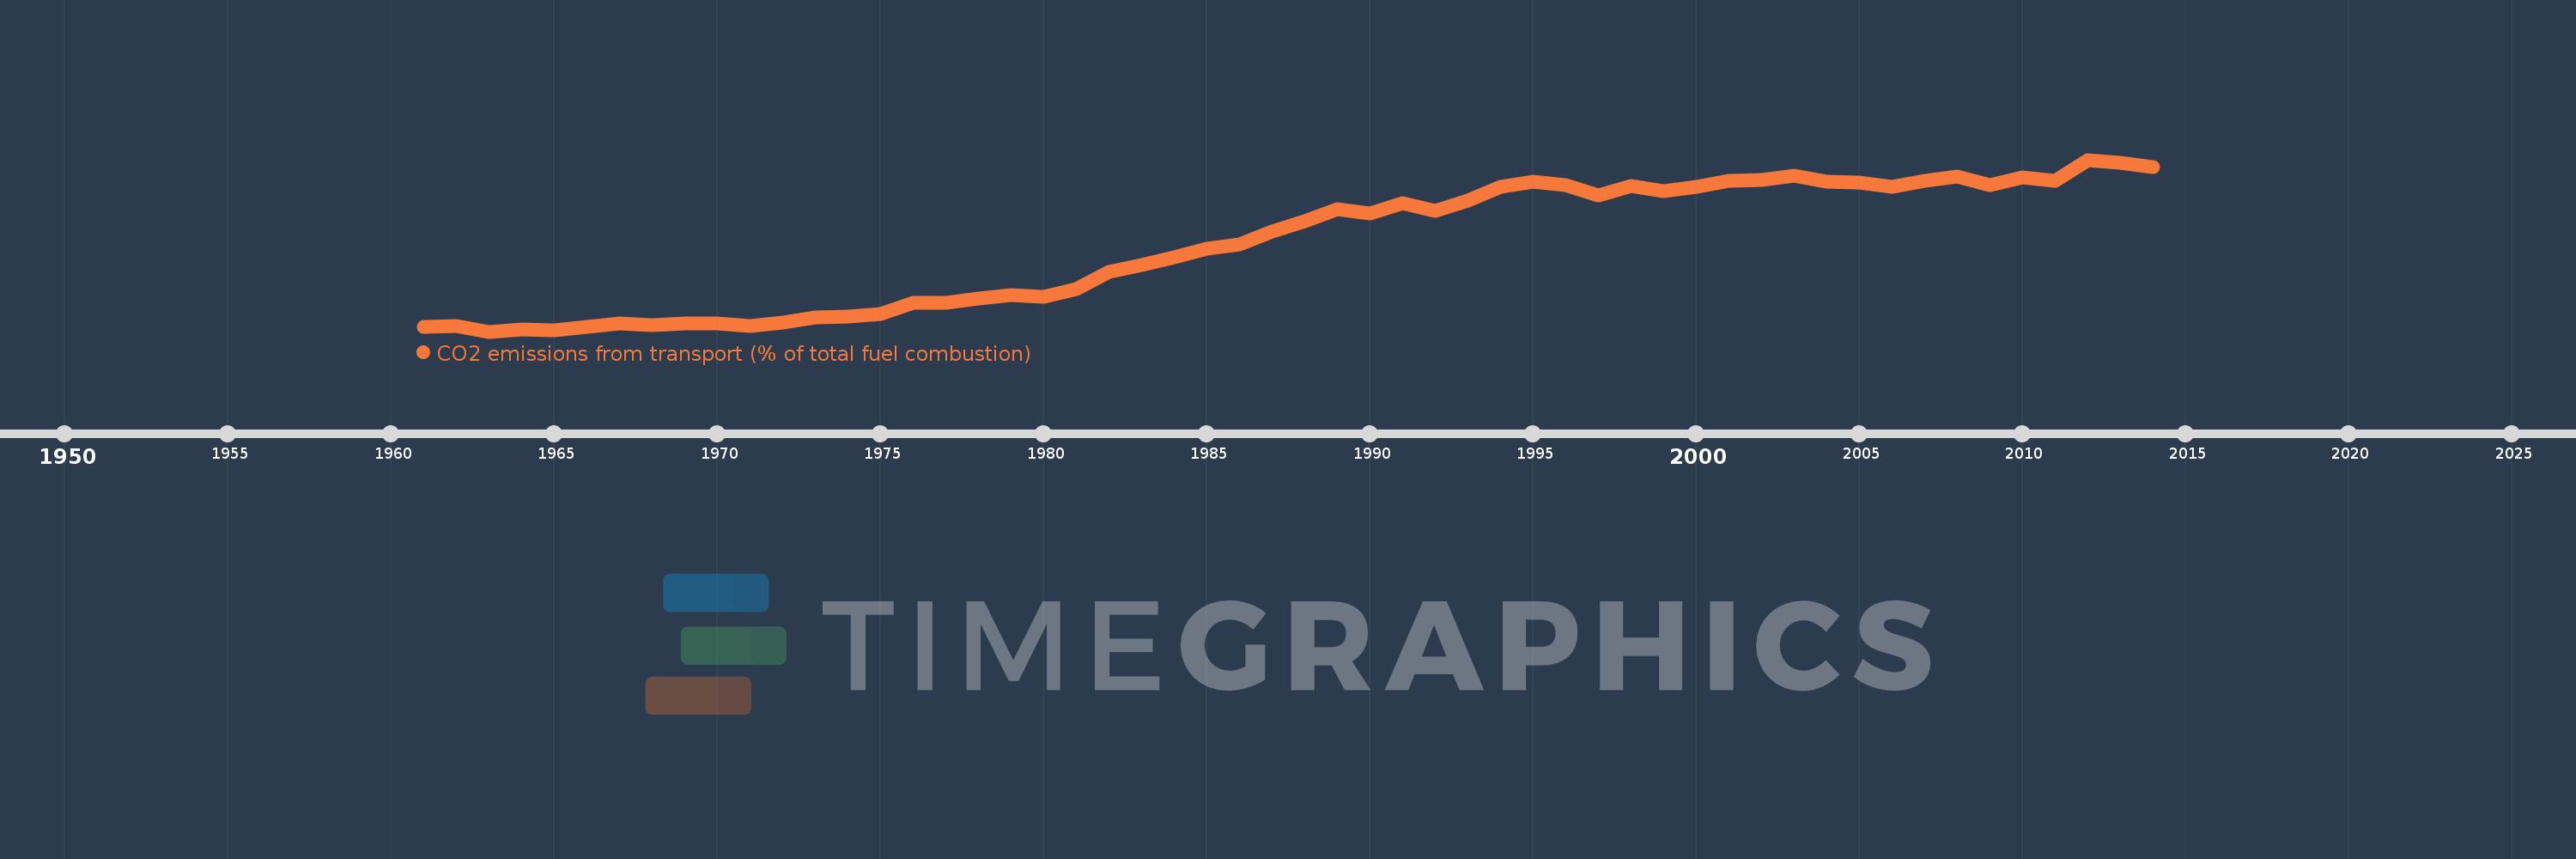
CO2 emissions from transport (% of total fuel combustion)
2014,2013,2012,2011,2010,2009,2008,2007,2006,2005,2004,2003,2002,2001,2000,1999,1998,1997,1996,1995,1994,1993,1992,1991,1990,1989,1988,1987,1986,1985,1984,1983,1982,1981,1980,1979,1978,1977,1976,1975,1974,1973,1972,1971,1970,1969,1968,1967,1966,1965,1964,1963,1962,1961
Queste statistiche in altri paesi:
AlbaniaAlgeriaAngolaArab WorldArgentinaArmeniaAustraliaAustriaAzerbaijanBahrainBangladeshBelarusBelgiumBeninBoliviaBosnia and HerzegovinaBotswanaBrazilBrunei DarussalamBulgariaCambodiaCameroonCanadaCaribbean small statesCentral Europe and the BalticsChileChinaColombiaCongo, Dem. Rep.Congo, Rep.Costa RicaCote d'IvoireCroatiaCubaCuracaoCyprusCzech RepublicDenmarkDominican RepublicEarly-demographic dividendEast Asia & PacificEast Asia & Pacific (excluding high income)East Asia & Pacific (IDA & IBRD countries)EcuadorEgypt, Arab Rep.El SalvadorEritreaEstoniaEthiopiaEuro areaEurope & Central AsiaEurope & Central Asia (excluding high income)Europe & Central Asia (IDA & IBRD countries)European UnionFinlandFragile and conflict affected situationsFranceGabonGeorgiaGermanyGhanaGibraltarGreeceGuatemalaHaitiHeavily indebted poor countries (HIPC)High incomeHondurasHong Kong SAR, ChinaHungaryIBRD onlyIcelandIDA & IBRD totalIDA blendIDA onlyIDA totalIndiaIndonesiaIran, Islamic Rep.IraqIrelandIsraelItalyJamaicaJapanJordanKazakhstanKenyaKorea, Dem. People’s Rep.Korea, Rep.KosovoKuwaitKyrgyz RepublicLate-demographic dividendLatin America & Caribbean Latin America & Caribbean (excluding high income)Latin America & the Caribbean (IDA & IBRD countries)LatviaLeast developed countries: UN classificationLebanonLibyaLithuaniaLow & middle incomeLow incomeLower middle incomeLuxembourgMacedonia, FYRMalaysiaMaltaMauritiusMexicoMiddle East & North AfricaMiddle East & North Africa (excluding high income)Middle East & North Africa (IDA & IBRD countries)Middle incomeMoldovaMongoliaMontenegroMoroccoMozambiqueMyanmarNamibiaNepalNetherlandsNew ZealandNicaraguaNigerNigeriaNorth AmericaNorwayOECD membersOmanOther small statesPakistanPanamaParaguayPeruPhilippinesPolandPortugalPost-demographic dividendPre-demographic dividendQatarRomaniaRussian FederationSaudi ArabiaSenegalSerbiaSingaporeSlovak RepublicSloveniaSmall statesSouth AfricaSouth AsiaSouth Asia (IDA & IBRD)South SudanSpainSri LankaSub-Saharan Africa Sub-Saharan Africa (excluding high income)Sub-Saharan Africa (IDA & IBRD countries)SudanSwedenSwitzerlandSyrian Arab RepublicTajikistanTanzaniaThailandTogoTrinidad and TobagoTunisiaTurkeyTurkmenistanUkraineUnited Arab EmiratesUnited KingdomUnited StatesUpper middle incomeUruguayUzbekistanVenezuela, RBVietnamWorldYemen, Rep.ZambiaZimbabwe Linea del tempo:
Questa scala temporale mostra un grafico dal 1961 anno al 2014 anno. France. I dati fino ad 1960 anno non disponibili. Il numero di osservazioni attuali secondo i date: 54.
La fonte (nome):
Indicatori dello sviluppo mondiale
La fonte (organizzazione):
IEA Statistics © OECD/IEA 2014 (http://www.iea.org/stats/index.asp), subject to https://www.iea.org/t&c/termsandconditions/
Categorie:
Environment
sono stati aggiornati
23 apr 2017 anni
Indicatori delle variazioni dei valori per anni
Minima:
12.833
1 gen 1963 anni
Massimo:
39.552
1 gen 2012 anni
Alla data di osservazione
Valore
Variazione assoluta
La variazione rispetto al valore precedente
1 gen 1961 anni
13.576
+13.576
0.0%
1 gen 1962 anni
13.754
+0.177
1.31%
1 gen 1963 anni
12.833
-0.921
-6.7%
1 gen 1964 anni
13.131
+0.298
2.33%
1 gen 1965 anni
12.984
-0.147
-1.12%
1 gen 1966 anni
13.52
+0.536
4.13%
1 gen 1967 anni
14.112
+0.592
4.38%
1 gen 1968 anni
13.803
-0.309
-2.19%
1 gen 1969 anni
14.135
+0.333
2.41%
1 gen 1970 anni
14.099
-0.036
-0.25%
1 gen 1971 anni
13.672
-0.428
-3.03%
1 gen 1972 anni
14.293
+0.621
4.54%
1 gen 1973 anni
15.021
+0.727
5.09%
1 gen 1974 anni
15.11
+0.089
0.6%
1 gen 1975 anni
15.584
+0.474
3.14%
1 gen 1976 anni
17.352
+1.768
11.35%
1 gen 1977 anni
17.301
-0.051
-0.29%
1 gen 1978 anni
18.019
+0.717
4.15%
1 gen 1979 anni
18.474
+0.455
2.53%
1 gen 1980 anni
18.293
-0.181
-0.98%
1 gen 1981 anni
19.422
+1.129
6.17%
1 gen 1982 anni
22.092
+2.67
13.75%
1 gen 1983 anni
23.248
+1.157
5.24%
1 gen 1984 anni
24.442
+1.194
5.14%
1 gen 1985 anni
25.726
+1.283
5.25%
1 gen 1986 anni
26.375
+0.649
2.52%
1 gen 1987 anni
28.431
+2.056
7.8%
1 gen 1988 anni
29.955
+1.524
5.36%
1 gen 1989 anni
31.933
+1.978
6.6%
1 gen 1990 anni
31.264
-0.669
-2.1%
1 gen 1991 anni
32.831
+1.567
5.01%
1 gen 1992 anni
31.548
-1.282
-3.91%
1 gen 1993 anni
33.209
+1.661
5.26%
1 gen 1994 anni
35.328
+2.119
6.38%
1 gen 1995 anni
36.145
+0.817
2.31%
1 gen 1996 anni
35.583
-0.563
-1.56%
1 gen 1997 anni
33.955
-1.627
-4.57%
1 gen 1998 anni
35.491
+1.536
4.52%
1 gen 1999 anni
34.653
-0.838
-2.36%
1 gen 2000 anni
35.318
+0.665
1.92%
1 gen 2001 anni
36.33
+1.012
2.86%
1 gen 2002 anni
36.465
+0.135
0.37%
1 gen 2003 anni
37.014
+0.549
1.51%
1 gen 2004 anni
36.083
-0.931
-2.52%
1 gen 2005 anni
36.07
-0.013
-0.04%
1 gen 2006 anni
35.281
-0.789
-2.19%
1 gen 2007 anni
36.298
+1.017
2.88%
1 gen 2008 anni
36.952
+0.654
1.8%
1 gen 2009 anni
35.63
-1.322
-3.58%
1 gen 2010 anni
36.88
+1.249
3.51%
1 gen 2011 anni
36.247
-0.632
-1.71%
1 gen 2012 anni
39.552
+3.305
9.12%
1 gen 2013 anni
39.098
-0.454
-1.15%
1 gen 2014 anni
38.359
-0.739
-1.89%
Classificazione dei paesi secondo i statistiche attuali per anni


Commenti: