29
/it/
it
AIzaSyAYiBZKx7MnpbEhh9jyipgxe19OcubqV5w
April 1, 2024
135314
Gabon
GAB
true
2
1
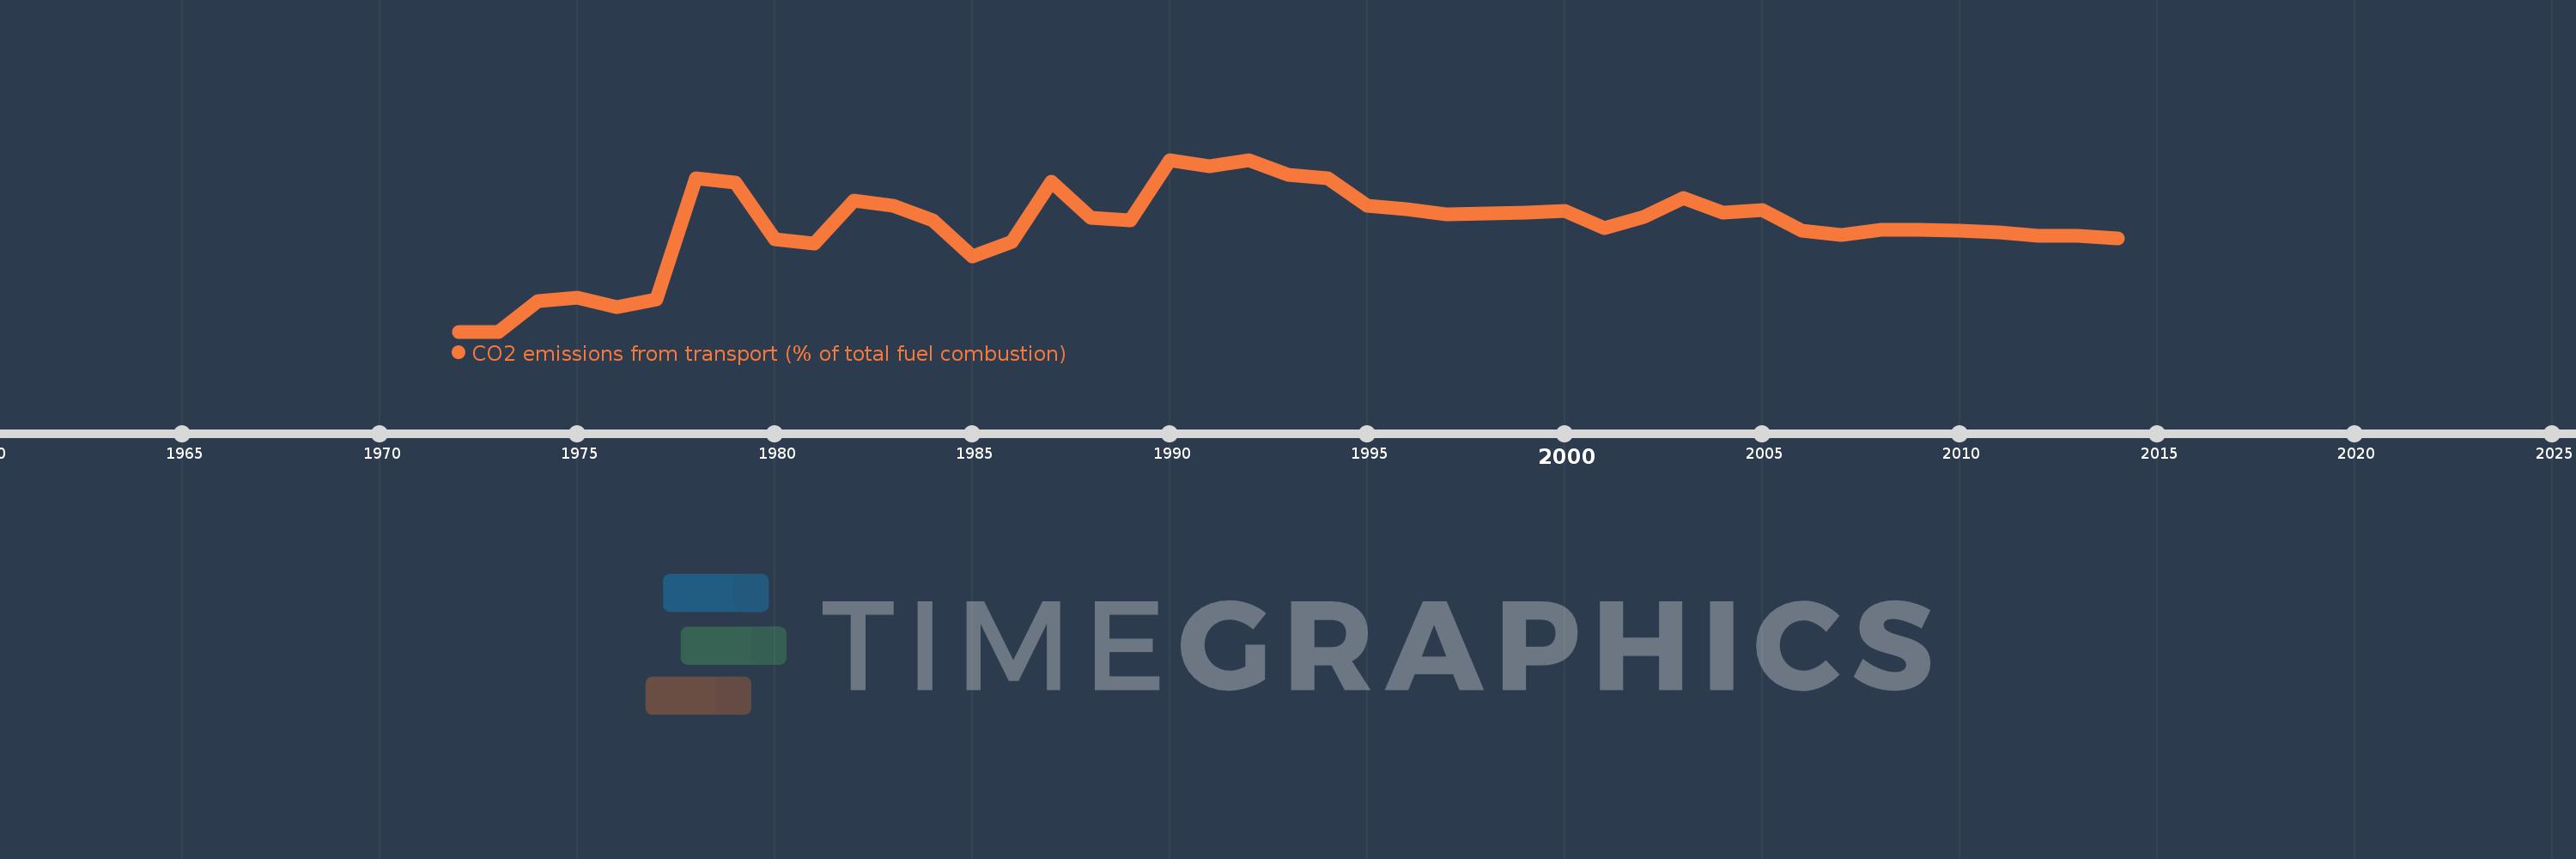
CO2 emissions from transport (% of total fuel combustion)
2014,2013,2012,2011,2010,2009,2008,2007,2006,2005,2004,2003,2002,2001,2000,1999,1998,1997,1996,1995,1994,1993,1992,1991,1990,1989,1988,1987,1986,1985,1984,1983,1982,1981,1980,1979,1978,1977,1976,1975,1974,1973,1972
Queste statistiche in altri paesi:
AlbaniaAlgeriaAngolaArab WorldArgentinaArmeniaAustraliaAustriaAzerbaijanBahrainBangladeshBelarusBelgiumBeninBoliviaBosnia and HerzegovinaBotswanaBrazilBrunei DarussalamBulgariaCambodiaCameroonCanadaCaribbean small statesCentral Europe and the BalticsChileChinaColombiaCongo, Dem. Rep.Congo, Rep.Costa RicaCote d'IvoireCroatiaCubaCuracaoCyprusCzech RepublicDenmarkDominican RepublicEarly-demographic dividendEast Asia & PacificEast Asia & Pacific (excluding high income)East Asia & Pacific (IDA & IBRD countries)EcuadorEgypt, Arab Rep.El SalvadorEritreaEstoniaEthiopiaEuro areaEurope & Central AsiaEurope & Central Asia (excluding high income)Europe & Central Asia (IDA & IBRD countries)European UnionFinlandFragile and conflict affected situationsFranceGabonGeorgiaGermanyGhanaGibraltarGreeceGuatemalaHaitiHeavily indebted poor countries (HIPC)High incomeHondurasHong Kong SAR, ChinaHungaryIBRD onlyIcelandIDA & IBRD totalIDA blendIDA onlyIDA totalIndiaIndonesiaIran, Islamic Rep.IraqIrelandIsraelItalyJamaicaJapanJordanKazakhstanKenyaKorea, Dem. People’s Rep.Korea, Rep.KosovoKuwaitKyrgyz RepublicLate-demographic dividendLatin America & Caribbean Latin America & Caribbean (excluding high income)Latin America & the Caribbean (IDA & IBRD countries)LatviaLeast developed countries: UN classificationLebanonLibyaLithuaniaLow & middle incomeLow incomeLower middle incomeLuxembourgMacedonia, FYRMalaysiaMaltaMauritiusMexicoMiddle East & North AfricaMiddle East & North Africa (excluding high income)Middle East & North Africa (IDA & IBRD countries)Middle incomeMoldovaMongoliaMontenegroMoroccoMozambiqueMyanmarNamibiaNepalNetherlandsNew ZealandNicaraguaNigerNigeriaNorth AmericaNorwayOECD membersOmanOther small statesPakistanPanamaParaguayPeruPhilippinesPolandPortugalPost-demographic dividendPre-demographic dividendQatarRomaniaRussian FederationSaudi ArabiaSenegalSerbiaSingaporeSlovak RepublicSloveniaSmall statesSouth AfricaSouth AsiaSouth Asia (IDA & IBRD)South SudanSpainSri LankaSub-Saharan Africa Sub-Saharan Africa (excluding high income)Sub-Saharan Africa (IDA & IBRD countries)SudanSwedenSwitzerlandSyrian Arab RepublicTajikistanTanzaniaThailandTogoTrinidad and TobagoTunisiaTurkeyTurkmenistanUkraineUnited Arab EmiratesUnited KingdomUnited StatesUpper middle incomeUruguayUzbekistanVenezuela, RBVietnamWorldYemen, Rep.ZambiaZimbabwe Linea del tempo:
Questa scala temporale mostra un grafico dal 1972 anno al 2014 anno. Gabon. I dati fino ad 1971 anno non disponibili. Il numero di osservazioni attuali secondo i date: 43.
La fonte (nome):
Indicatori dello sviluppo mondiale
La fonte (organizzazione):
IEA Statistics © OECD/IEA 2014 (http://www.iea.org/stats/index.asp), subject to https://www.iea.org/t&c/termsandconditions/
Categorie:
Environment
sono stati aggiornati
23 apr 2017 anni
Indicatori delle variazioni dei valori per anni
Minima:
0.0
1 gen 1972 anni
Massimo:
36.449
1 gen 1992 anni
Alla data di osservazione
Valore
Variazione assoluta
La variazione rispetto al valore precedente
1 gen 1972 anni
0.0
0.0
0.0%
1 gen 1974 anni
6.557
+6.557
%
1 gen 1975 anni
7.143
+0.585
8.93%
1 gen 1976 anni
5.263
-1.88
-26.32%
1 gen 1977 anni
6.838
+1.574
29.91%
1 gen 1978 anni
32.576
+25.738
376.42%
1 gen 1979 anni
31.609
-0.967
-2.97%
1 gen 1980 anni
19.549
-12.06
-38.15%
1 gen 1981 anni
18.605
-0.944
-4.83%
1 gen 1982 anni
27.778
+9.173
49.31%
1 gen 1983 anni
26.705
-1.073
-3.86%
1 gen 1984 anni
23.626
-3.078
-11.53%
1 gen 1985 anni
15.894
-7.732
-32.73%
1 gen 1986 anni
19.048
+3.154
19.84%
1 gen 1987 anni
31.757
+12.709
66.72%
1 gen 1988 anni
24.219
-7.538
-23.74%
1 gen 1989 anni
23.611
-0.608
-2.51%
1 gen 1990 anni
36.283
+12.672
53.67%
1 gen 1991 anni
35.165
-1.118
-3.08%
1 gen 1992 anni
36.449
+1.284
3.65%
1 gen 1993 anni
33.333
-3.115
-8.55%
1 gen 1994 anni
32.5
-0.833
-2.5%
1 gen 1995 anni
26.724
-5.776
-17.77%
1 gen 1996 anni
25.954
-0.77
-2.88%
1 gen 1997 anni
24.823
-1.132
-4.36%
1 gen 1998 anni
25.0
+0.177
0.71%
1 gen 1999 anni
25.309
+0.309
1.23%
1 gen 2000 anni
25.658
+0.349
1.38%
1 gen 2001 anni
21.918
-3.74
-14.58%
1 gen 2002 anni
24.324
+2.407
10.98%
1 gen 2003 anni
28.261
+3.937
16.18%
1 gen 2004 anni
25.18
-3.081
-10.9%
1 gen 2005 anni
25.874
+0.694
2.76%
1 gen 2006 anni
21.387
-4.487
-17.34%
1 gen 2007 anni
20.556
-0.832
-3.89%
1 gen 2008 anni
21.649
+1.094
5.32%
1 gen 2009 anni
21.608
-0.041
-0.19%
1 gen 2010 anni
21.495
-0.113
-0.52%
1 gen 2011 anni
21.097
-0.398
-1.85%
1 gen 2012 anni
20.243
-0.854
-4.05%
1 gen 2013 anni
20.307
+0.064
0.31%
1 gen 2014 anni
19.788
-0.519
-2.55%
Classificazione dei paesi secondo i statistiche attuali per anni


Commenti: