29
/it/
it
AIzaSyAYiBZKx7MnpbEhh9jyipgxe19OcubqV5w
April 1, 2024
121884
Dominican Republic
DOM
true
2
1
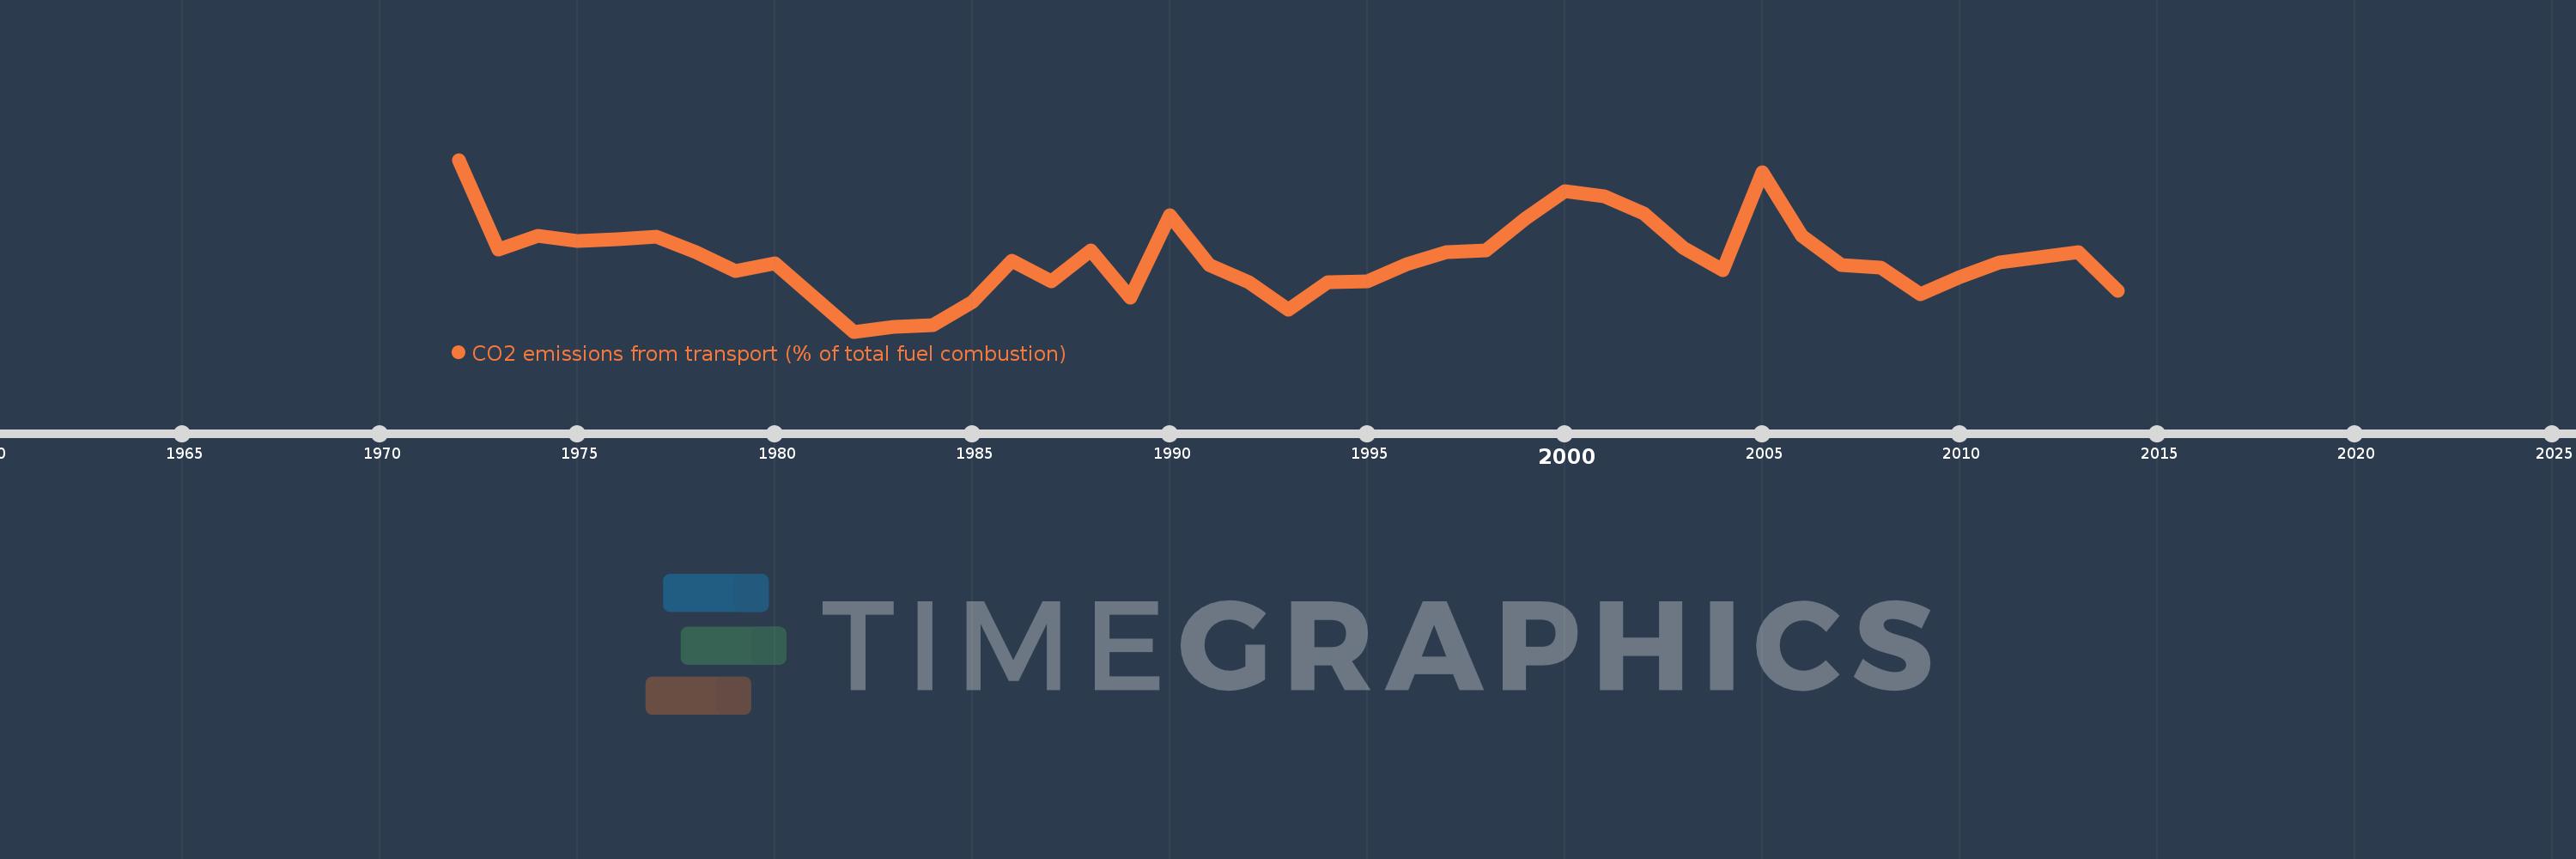
CO2 emissions from transport (% of total fuel combustion)
2014,2013,2012,2011,2010,2009,2008,2007,2006,2005,2004,2003,2002,2001,2000,1999,1998,1997,1996,1995,1994,1993,1992,1991,1990,1989,1988,1987,1986,1985,1984,1983,1982,1981,1980,1979,1978,1977,1976,1975,1974,1973,1972
Queste statistiche in altri paesi:
AlbaniaAlgeriaAngolaArab WorldArgentinaArmeniaAustraliaAustriaAzerbaijanBahrainBangladeshBelarusBelgiumBeninBoliviaBosnia and HerzegovinaBotswanaBrazilBrunei DarussalamBulgariaCambodiaCameroonCanadaCaribbean small statesCentral Europe and the BalticsChileChinaColombiaCongo, Dem. Rep.Congo, Rep.Costa RicaCote d'IvoireCroatiaCubaCuracaoCyprusCzech RepublicDenmarkDominican RepublicEarly-demographic dividendEast Asia & PacificEast Asia & Pacific (excluding high income)East Asia & Pacific (IDA & IBRD countries)EcuadorEgypt, Arab Rep.El SalvadorEritreaEstoniaEthiopiaEuro areaEurope & Central AsiaEurope & Central Asia (excluding high income)Europe & Central Asia (IDA & IBRD countries)European UnionFinlandFragile and conflict affected situationsFranceGabonGeorgiaGermanyGhanaGibraltarGreeceGuatemalaHaitiHeavily indebted poor countries (HIPC)High incomeHondurasHong Kong SAR, ChinaHungaryIBRD onlyIcelandIDA & IBRD totalIDA blendIDA onlyIDA totalIndiaIndonesiaIran, Islamic Rep.IraqIrelandIsraelItalyJamaicaJapanJordanKazakhstanKenyaKorea, Dem. People’s Rep.Korea, Rep.KosovoKuwaitKyrgyz RepublicLate-demographic dividendLatin America & Caribbean Latin America & Caribbean (excluding high income)Latin America & the Caribbean (IDA & IBRD countries)LatviaLeast developed countries: UN classificationLebanonLibyaLithuaniaLow & middle incomeLow incomeLower middle incomeLuxembourgMacedonia, FYRMalaysiaMaltaMauritiusMexicoMiddle East & North AfricaMiddle East & North Africa (excluding high income)Middle East & North Africa (IDA & IBRD countries)Middle incomeMoldovaMongoliaMontenegroMoroccoMozambiqueMyanmarNamibiaNepalNetherlandsNew ZealandNicaraguaNigerNigeriaNorth AmericaNorwayOECD membersOmanOther small statesPakistanPanamaParaguayPeruPhilippinesPolandPortugalPost-demographic dividendPre-demographic dividendQatarRomaniaRussian FederationSaudi ArabiaSenegalSerbiaSingaporeSlovak RepublicSloveniaSmall statesSouth AfricaSouth AsiaSouth Asia (IDA & IBRD)South SudanSpainSri LankaSub-Saharan Africa Sub-Saharan Africa (excluding high income)Sub-Saharan Africa (IDA & IBRD countries)SudanSwedenSwitzerlandSyrian Arab RepublicTajikistanTanzaniaThailandTogoTrinidad and TobagoTunisiaTurkeyTurkmenistanUkraineUnited Arab EmiratesUnited KingdomUnited StatesUpper middle incomeUruguayUzbekistanVenezuela, RBVietnamWorldYemen, Rep.ZambiaZimbabwe Linea del tempo:
Questa scala temporale mostra un grafico dal 1972 anno al 2014 anno. Dominican Republic. I dati fino ad 1971 anno non disponibili. Il numero di osservazioni attuali secondo i date: 43.
La fonte (nome):
Indicatori dello sviluppo mondiale
La fonte (organizzazione):
IEA Statistics © OECD/IEA 2014 (http://www.iea.org/stats/index.asp), subject to https://www.iea.org/t&c/termsandconditions/
Categorie:
Environment
sono stati aggiornati
23 apr 2017 anni
Indicatori delle variazioni dei valori per anni
Minima:
25.167
1 gen 1982 anni
Massimo:
40.805
1 gen 1972 anni
Alla data di osservazione
Valore
Variazione assoluta
La variazione rispetto al valore precedente
1 gen 1972 anni
40.805
+40.805
0.0%
1 gen 1973 anni
32.604
-8.201
-20.1%
1 gen 1974 anni
33.909
+1.305
4.0%
1 gen 1975 anni
33.4
-0.509
-1.5%
1 gen 1976 anni
33.589
+0.189
0.57%
1 gen 1977 anni
33.832
+0.243
0.72%
1 gen 1978 anni
32.394
-1.437
-4.25%
1 gen 1979 anni
30.703
-1.691
-5.22%
1 gen 1980 anni
31.382
+0.679
2.21%
1 gen 1981 anni
28.278
-3.104
-9.89%
1 gen 1982 anni
25.167
-3.111
-11.0%
1 gen 1983 anni
25.561
+0.395
1.57%
1 gen 1984 anni
25.778
+0.216
0.85%
1 gen 1985 anni
27.864
+2.086
8.09%
1 gen 1986 anni
31.621
+3.757
13.48%
1 gen 1987 anni
29.745
-1.876
-5.93%
1 gen 1988 anni
32.55
+2.804
9.43%
1 gen 1989 anni
28.29
-4.259
-13.09%
1 gen 1990 anni
35.797
+7.506
26.53%
1 gen 1991 anni
31.216
-4.581
-12.8%
1 gen 1992 anni
29.649
-1.567
-5.02%
1 gen 1993 anni
27.132
-2.517
-8.49%
1 gen 1994 anni
29.654
+2.523
9.3%
1 gen 1995 anni
29.773
+0.119
0.4%
1 gen 1996 anni
31.311
+1.538
5.17%
1 gen 1997 anni
32.363
+1.051
3.36%
1 gen 1998 anni
32.531
+0.168
0.52%
1 gen 1999 anni
35.457
+2.926
8.99%
1 gen 2000 anni
37.931
+2.474
6.98%
1 gen 2001 anni
37.446
-0.485
-1.28%
1 gen 2002 anni
35.885
-1.561
-4.17%
1 gen 2003 anni
32.824
-3.061
-8.53%
1 gen 2004 anni
30.755
-2.069
-6.3%
1 gen 2005 anni
39.676
+8.921
29.01%
1 gen 2006 anni
33.85
-5.827
-14.69%
1 gen 2007 anni
31.206
-2.644
-7.81%
1 gen 2008 anni
30.991
-0.215
-0.69%
1 gen 2009 anni
28.571
-2.42
-7.81%
1 gen 2010 anni
30.104
+1.533
5.36%
1 gen 2011 anni
31.496
+1.392
4.62%
1 gen 2012 anni
31.934
+0.438
1.39%
1 gen 2013 anni
32.382
+0.449
1.41%
1 gen 2014 anni
28.898
-3.484
-10.76%
Classificazione dei paesi secondo i statistiche attuali per anni


Commenti: