29
/it/
it
AIzaSyAYiBZKx7MnpbEhh9jyipgxe19OcubqV5w
April 1, 2024
158292
Iraq
IRQ
true
2
1
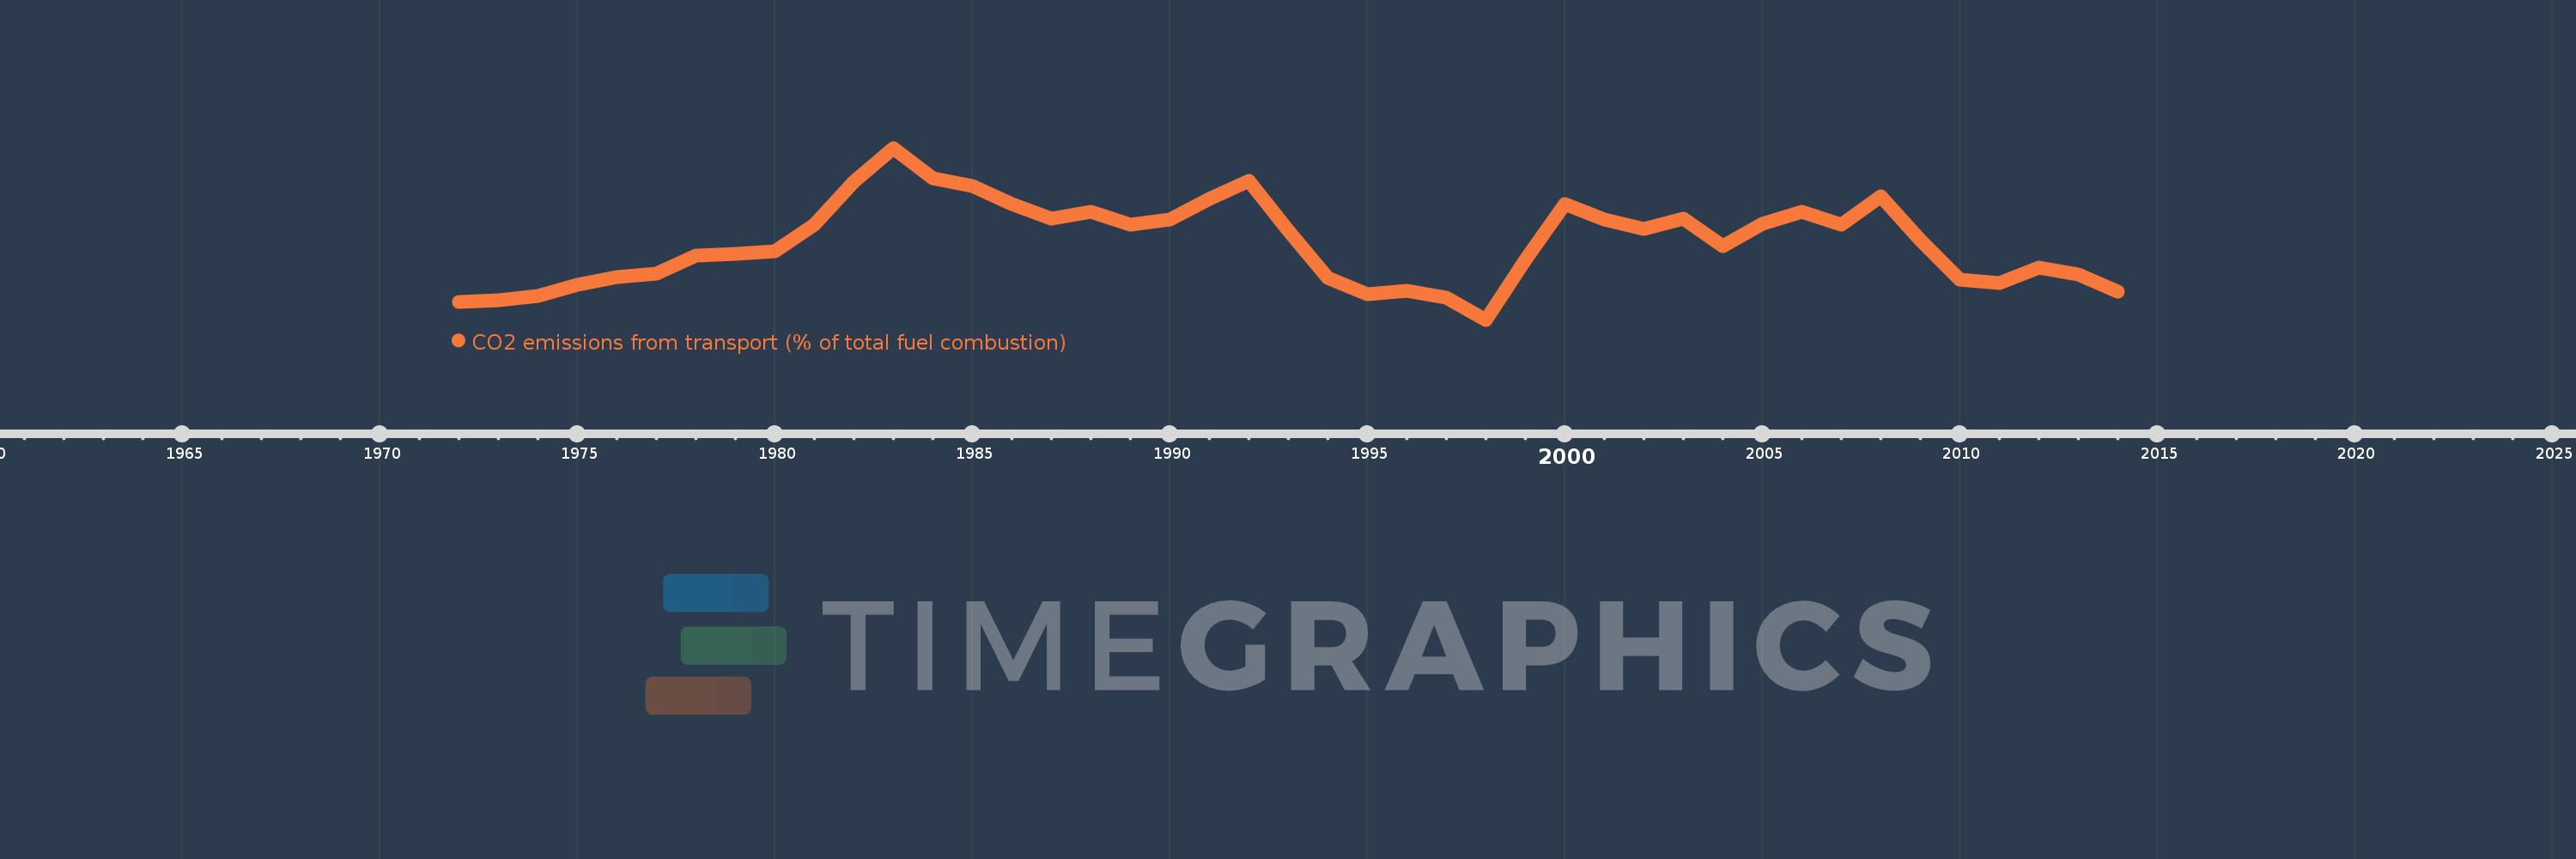
CO2 emissions from transport (% of total fuel combustion)
2014,2013,2012,2011,2010,2009,2008,2007,2006,2005,2004,2003,2002,2001,2000,1999,1998,1997,1996,1995,1994,1993,1992,1991,1990,1989,1988,1987,1986,1985,1984,1983,1982,1981,1980,1979,1978,1977,1976,1975,1974,1973,1972
Queste statistiche in altri paesi:
AlbaniaAlgeriaAngolaArab WorldArgentinaArmeniaAustraliaAustriaAzerbaijanBahrainBangladeshBelarusBelgiumBeninBoliviaBosnia and HerzegovinaBotswanaBrazilBrunei DarussalamBulgariaCambodiaCameroonCanadaCaribbean small statesCentral Europe and the BalticsChileChinaColombiaCongo, Dem. Rep.Congo, Rep.Costa RicaCote d'IvoireCroatiaCubaCuracaoCyprusCzech RepublicDenmarkDominican RepublicEarly-demographic dividendEast Asia & PacificEast Asia & Pacific (excluding high income)East Asia & Pacific (IDA & IBRD countries)EcuadorEgypt, Arab Rep.El SalvadorEritreaEstoniaEthiopiaEuro areaEurope & Central AsiaEurope & Central Asia (excluding high income)Europe & Central Asia (IDA & IBRD countries)European UnionFinlandFragile and conflict affected situationsFranceGabonGeorgiaGermanyGhanaGibraltarGreeceGuatemalaHaitiHeavily indebted poor countries (HIPC)High incomeHondurasHong Kong SAR, ChinaHungaryIBRD onlyIcelandIDA & IBRD totalIDA blendIDA onlyIDA totalIndiaIndonesiaIran, Islamic Rep.IraqIrelandIsraelItalyJamaicaJapanJordanKazakhstanKenyaKorea, Dem. People’s Rep.Korea, Rep.KosovoKuwaitKyrgyz RepublicLate-demographic dividendLatin America & Caribbean Latin America & Caribbean (excluding high income)Latin America & the Caribbean (IDA & IBRD countries)LatviaLeast developed countries: UN classificationLebanonLibyaLithuaniaLow & middle incomeLow incomeLower middle incomeLuxembourgMacedonia, FYRMalaysiaMaltaMauritiusMexicoMiddle East & North AfricaMiddle East & North Africa (excluding high income)Middle East & North Africa (IDA & IBRD countries)Middle incomeMoldovaMongoliaMontenegroMoroccoMozambiqueMyanmarNamibiaNepalNetherlandsNew ZealandNicaraguaNigerNigeriaNorth AmericaNorwayOECD membersOmanOther small statesPakistanPanamaParaguayPeruPhilippinesPolandPortugalPost-demographic dividendPre-demographic dividendQatarRomaniaRussian FederationSaudi ArabiaSenegalSerbiaSingaporeSlovak RepublicSloveniaSmall statesSouth AfricaSouth AsiaSouth Asia (IDA & IBRD)South SudanSpainSri LankaSub-Saharan Africa Sub-Saharan Africa (excluding high income)Sub-Saharan Africa (IDA & IBRD countries)SudanSwedenSwitzerlandSyrian Arab RepublicTajikistanTanzaniaThailandTogoTrinidad and TobagoTunisiaTurkeyTurkmenistanUkraineUnited Arab EmiratesUnited KingdomUnited StatesUpper middle incomeUruguayUzbekistanVenezuela, RBVietnamWorldYemen, Rep.ZambiaZimbabwe Linea del tempo:
Questa scala temporale mostra un grafico dal 1972 anno al 2014 anno. Iraq. I dati fino ad 1971 anno non disponibili. Il numero di osservazioni attuali secondo i date: 43.
La fonte (nome):
Indicatori dello sviluppo mondiale
La fonte (organizzazione):
IEA Statistics © OECD/IEA 2014 (http://www.iea.org/stats/index.asp), subject to https://www.iea.org/t&c/termsandconditions/
Categorie:
Environment
sono stati aggiornati
23 apr 2017 anni
Indicatori delle variazioni dei valori per anni
Minima:
20.909
1 gen 1998 anni
Massimo:
49.521
1 gen 1983 anni
Alla data di osservazione
Valore
Variazione assoluta
La variazione rispetto al valore precedente
1 gen 1972 anni
23.86
+23.86
0.0%
1 gen 1973 anni
24.108
+0.248
1.04%
1 gen 1974 anni
24.915
+0.807
3.35%
1 gen 1975 anni
26.677
+1.762
7.07%
1 gen 1976 anni
28.01
+1.333
5.0%
1 gen 1977 anni
28.527
+0.517
1.84%
1 gen 1978 anni
31.532
+3.005
10.53%
1 gen 1979 anni
31.924
+0.392
1.24%
1 gen 1980 anni
32.278
+0.353
1.11%
1 gen 1981 anni
36.787
+4.51
13.97%
1 gen 1982 anni
43.949
+7.162
19.47%
1 gen 1983 anni
49.521
+5.572
12.68%
1 gen 1984 anni
44.515
-5.006
-10.11%
1 gen 1985 anni
43.144
-1.371
-3.08%
1 gen 1986 anni
40.216
-2.928
-6.79%
1 gen 1987 anni
37.74
-2.476
-6.16%
1 gen 1988 anni
38.862
+1.122
2.97%
1 gen 1989 anni
36.685
-2.177
-5.6%
1 gen 1990 anni
37.664
+0.979
2.67%
1 gen 1991 anni
41.028
+3.364
8.93%
1 gen 1992 anni
44.027
+2.999
7.31%
1 gen 1993 anni
35.78
-8.246
-18.73%
1 gen 1994 anni
27.892
-7.889
-22.05%
1 gen 1995 anni
25.089
-2.803
-10.05%
1 gen 1996 anni
25.769
+0.681
2.71%
1 gen 1997 anni
24.579
-1.19
-4.62%
1 gen 1998 anni
20.909
-3.669
-14.93%
1 gen 1999 anni
30.839
+9.929
47.49%
1 gen 2000 anni
40.173
+9.334
30.27%
1 gen 2001 anni
37.56
-2.613
-6.5%
1 gen 2002 anni
36.023
-1.537
-4.09%
1 gen 2003 anni
37.693
+1.67
4.64%
1 gen 2004 anni
33.207
-4.486
-11.9%
1 gen 2005 anni
36.866
+3.658
11.02%
1 gen 2006 anni
38.856
+1.99
5.4%
1 gen 2007 anni
36.768
-2.088
-5.37%
1 gen 2008 anni
41.412
+4.643
12.63%
1 gen 2009 anni
34.14
-7.272
-17.56%
1 gen 2010 anni
27.62
-6.52
-19.1%
1 gen 2011 anni
27.0
-0.62
-2.24%
1 gen 2012 anni
29.561
+2.56
9.48%
1 gen 2013 anni
28.387
-1.173
-3.97%
1 gen 2014 anni
25.656
-2.731
-9.62%
Classificazione dei paesi secondo i statistiche attuali per anni


Commenti: