29
/it/
it
AIzaSyAYiBZKx7MnpbEhh9jyipgxe19OcubqV5w
April 1, 2024
169718
Korea, Rep.
KOR
true
2
1
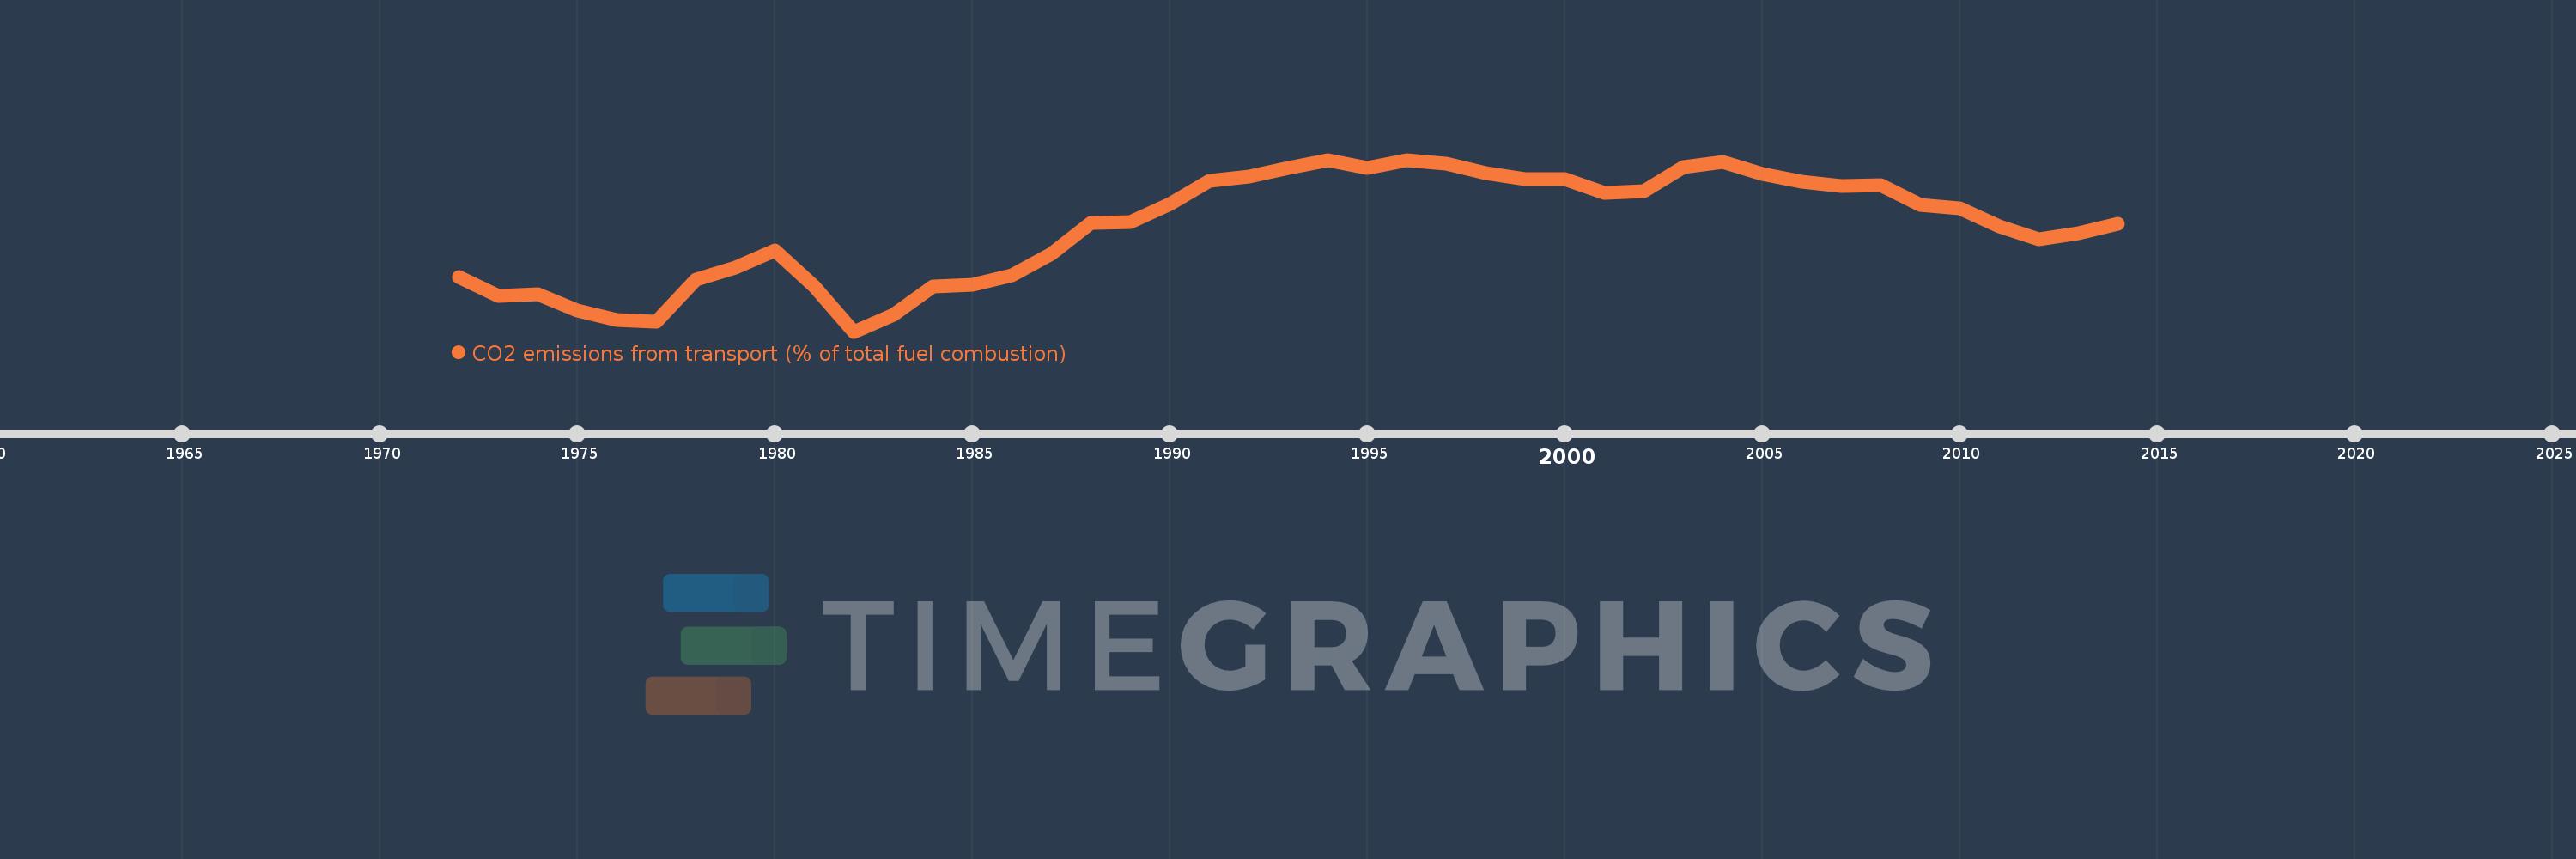
CO2 emissions from transport (% of total fuel combustion)
2014,2013,2012,2011,2010,2009,2008,2007,2006,2005,2004,2003,2002,2001,2000,1999,1998,1997,1996,1995,1994,1993,1992,1991,1990,1989,1988,1987,1986,1985,1984,1983,1982,1981,1980,1979,1978,1977,1976,1975,1974,1973,1972
Queste statistiche in altri paesi:
AlbaniaAlgeriaAngolaArab WorldArgentinaArmeniaAustraliaAustriaAzerbaijanBahrainBangladeshBelarusBelgiumBeninBoliviaBosnia and HerzegovinaBotswanaBrazilBrunei DarussalamBulgariaCambodiaCameroonCanadaCaribbean small statesCentral Europe and the BalticsChileChinaColombiaCongo, Dem. Rep.Congo, Rep.Costa RicaCote d'IvoireCroatiaCubaCuracaoCyprusCzech RepublicDenmarkDominican RepublicEarly-demographic dividendEast Asia & PacificEast Asia & Pacific (excluding high income)East Asia & Pacific (IDA & IBRD countries)EcuadorEgypt, Arab Rep.El SalvadorEritreaEstoniaEthiopiaEuro areaEurope & Central AsiaEurope & Central Asia (excluding high income)Europe & Central Asia (IDA & IBRD countries)European UnionFinlandFragile and conflict affected situationsFranceGabonGeorgiaGermanyGhanaGibraltarGreeceGuatemalaHaitiHeavily indebted poor countries (HIPC)High incomeHondurasHong Kong SAR, ChinaHungaryIBRD onlyIcelandIDA & IBRD totalIDA blendIDA onlyIDA totalIndiaIndonesiaIran, Islamic Rep.IraqIrelandIsraelItalyJamaicaJapanJordanKazakhstanKenyaKorea, Dem. People’s Rep.Korea, Rep.KosovoKuwaitKyrgyz RepublicLate-demographic dividendLatin America & Caribbean Latin America & Caribbean (excluding high income)Latin America & the Caribbean (IDA & IBRD countries)LatviaLeast developed countries: UN classificationLebanonLibyaLithuaniaLow & middle incomeLow incomeLower middle incomeLuxembourgMacedonia, FYRMalaysiaMaltaMauritiusMexicoMiddle East & North AfricaMiddle East & North Africa (excluding high income)Middle East & North Africa (IDA & IBRD countries)Middle incomeMoldovaMongoliaMontenegroMoroccoMozambiqueMyanmarNamibiaNepalNetherlandsNew ZealandNicaraguaNigerNigeriaNorth AmericaNorwayOECD membersOmanOther small statesPakistanPanamaParaguayPeruPhilippinesPolandPortugalPost-demographic dividendPre-demographic dividendQatarRomaniaRussian FederationSaudi ArabiaSenegalSerbiaSingaporeSlovak RepublicSloveniaSmall statesSouth AfricaSouth AsiaSouth Asia (IDA & IBRD)South SudanSpainSri LankaSub-Saharan Africa Sub-Saharan Africa (excluding high income)Sub-Saharan Africa (IDA & IBRD countries)SudanSwedenSwitzerlandSyrian Arab RepublicTajikistanTanzaniaThailandTogoTrinidad and TobagoTunisiaTurkeyTurkmenistanUkraineUnited Arab EmiratesUnited KingdomUnited StatesUpper middle incomeUruguayUzbekistanVenezuela, RBVietnamWorldYemen, Rep.ZambiaZimbabwe Linea del tempo:
Questa scala temporale mostra un grafico dal 1972 anno al 2014 anno. Korea, Rep.. I dati fino ad 1971 anno non disponibili. Il numero di osservazioni attuali secondo i date: 43.
La fonte (nome):
Indicatori dello sviluppo mondiale
La fonte (organizzazione):
IEA Statistics © OECD/IEA 2014 (http://www.iea.org/stats/index.asp), subject to https://www.iea.org/t&c/termsandconditions/
Categorie:
Environment
sono stati aggiornati
23 apr 2017 anni
Indicatori delle variazioni dei valori per anni
Minima:
8.474
1 gen 1982 anni
Massimo:
20.307
1 gen 1994 anni
Alla data di osservazione
Valore
Variazione assoluta
La variazione rispetto al valore precedente
1 gen 1972 anni
12.259
+12.259
0.0%
1 gen 1973 anni
10.921
-1.338
-10.92%
1 gen 1974 anni
11.066
+0.145
1.33%
1 gen 1975 anni
9.915
-1.151
-10.4%
1 gen 1976 anni
9.264
-0.651
-6.56%
1 gen 1977 anni
9.179
-0.085
-0.91%
1 gen 1978 anni
12.068
+2.888
31.47%
1 gen 1979 anni
12.886
+0.819
6.78%
1 gen 1980 anni
14.072
+1.186
9.2%
1 gen 1981 anni
11.563
-2.509
-17.83%
1 gen 1982 anni
8.474
-3.089
-26.71%
1 gen 1983 anni
9.605
+1.131
13.35%
1 gen 1984 anni
11.601
+1.996
20.78%
1 gen 1985 anni
11.724
+0.122
1.06%
1 gen 1986 anni
12.351
+0.628
5.35%
1 gen 1987 anni
13.811
+1.459
11.81%
1 gen 1988 anni
15.986
+2.175
15.75%
1 gen 1989 anni
16.038
+0.052
0.33%
1 gen 1990 anni
17.268
+1.23
7.67%
1 gen 1991 anni
18.873
+1.605
9.29%
1 gen 1992 anni
19.169
+0.297
1.57%
1 gen 1993 anni
19.761
+0.592
3.09%
1 gen 1994 anni
20.307
+0.545
2.76%
1 gen 1995 anni
19.723
-0.583
-2.87%
1 gen 1996 anni
20.286
+0.563
2.85%
1 gen 1997 anni
20.013
-0.273
-1.35%
1 gen 1998 anni
19.407
-0.606
-3.03%
1 gen 1999 anni
18.965
-0.442
-2.28%
1 gen 2000 anni
18.99
+0.025
0.13%
1 gen 2001 anni
18.01
-0.98
-5.16%
1 gen 2002 anni
18.165
+0.156
0.86%
1 gen 2003 anni
19.82
+1.654
9.11%
1 gen 2004 anni
20.17
+0.351
1.77%
1 gen 2005 anni
19.346
-0.824
-4.09%
1 gen 2006 anni
18.806
-0.54
-2.79%
1 gen 2007 anni
18.5
-0.307
-1.63%
1 gen 2008 anni
18.567
+0.067
0.36%
1 gen 2009 anni
17.218
-1.349
-7.27%
1 gen 2010 anni
16.943
-0.275
-1.6%
1 gen 2011 anni
15.719
-1.224
-7.22%
1 gen 2012 anni
14.837
-0.882
-5.61%
1 gen 2013 anni
15.221
+0.384
2.58%
1 gen 2014 anni
15.876
+0.655
4.3%
Classificazione dei paesi secondo i statistiche attuali per anni


Commenti: