29
/it/
it
AIzaSyAYiBZKx7MnpbEhh9jyipgxe19OcubqV5w
April 1, 2024
45693
Low & middle income
LMY
false
2
1
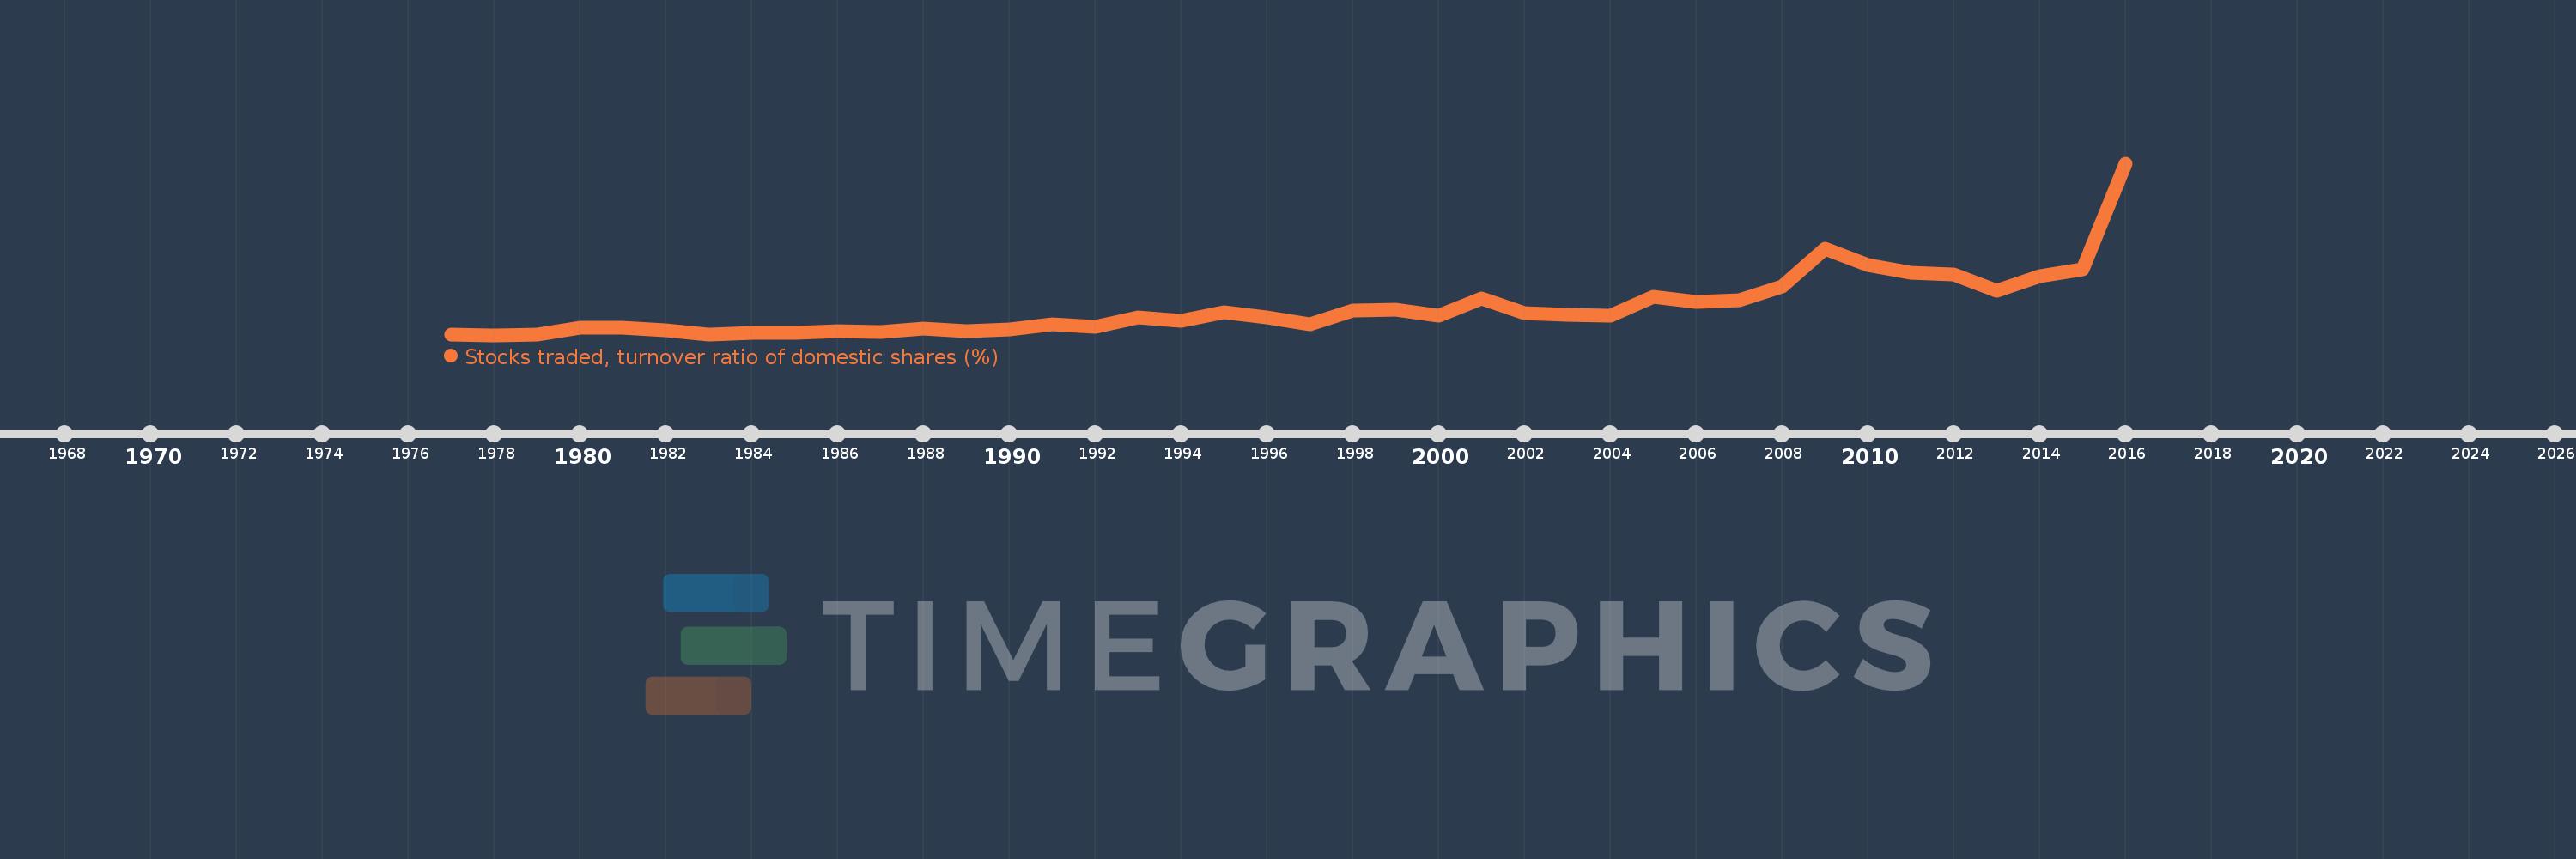
Stocks traded, turnover ratio of domestic shares (%)
2016,2015,2014,2013,2012,2011,2010,2009,2008,2007,2006,2005,2004,2003,2002,2001,2000,1999,1998,1997,1996,1995,1994,1993,1992,1991,1990,1989,1988,1987,1986,1985,1984,1983,1982,1981,1980,1979,1978,1977
Queste statistiche in altri paesi:
Linea del tempo:
Questa scala temporale mostra un grafico dal 1977 anno al 2016 anno. Low & middle income. I dati fino ad 1976 anno non disponibili. Il numero di osservazioni attuali secondo i date: 40.
La fonte (nome):
Indicatori dello sviluppo mondiale
La fonte (organizzazione):
World Federation of Exchanges database.
Categorie:
Financial Sector
sono stati aggiornati
23 apr 2017 anni
Indicatori delle variazioni dei valori per anni
Minima:
3.726
1 gen 1978 anni
Massimo:
278.112
1 gen 2016 anni
Alla data di osservazione
Valore
Variazione assoluta
La variazione rispetto al valore precedente
1 gen 1977 anni
4.377
+4.377
0.0%
1 gen 1978 anni
3.726
-0.651
-14.87%
1 gen 1979 anni
4.893
+1.167
31.32%
1 gen 1980 anni
14.735
+9.842
201.16%
1 gen 1981 anni
16.063
+1.328
9.01%
1 gen 1982 anni
10.703
-5.359
-33.37%
1 gen 1983 anni
5.078
-5.626
-52.56%
1 gen 1984 anni
6.475
+1.398
27.53%
1 gen 1985 anni
7.078
+0.602
9.3%
1 gen 1986 anni
9.643
+2.565
36.24%
1 gen 1987 anni
8.776
-0.867
-8.99%
1 gen 1988 anni
14.109
+5.332
60.76%
1 gen 1989 anni
9.752
-4.356
-30.88%
1 gen 1990 anni
12.062
+2.31
23.68%
1 gen 1991 anni
20.963
+8.901
73.8%
1 gen 1992 anni
17.413
-3.551
-16.94%
1 gen 1993 anni
31.439
+14.026
80.55%
1 gen 1994 anni
26.451
-4.988
-15.87%
1 gen 1995 anni
40.145
+13.694
51.77%
1 gen 1996 anni
31.388
-8.758
-21.81%
1 gen 1997 anni
20.629
-10.759
-34.28%
1 gen 1998 anni
42.416
+21.787
105.61%
1 gen 1999 anni
44.537
+2.121
5.0%
1 gen 2000 anni
34.059
-10.478
-23.53%
1 gen 2001 anni
62.283
+28.224
82.87%
1 gen 2002 anni
39.218
-23.065
-37.03%
1 gen 2003 anni
36.491
-2.727
-6.95%
1 gen 2004 anni
34.617
-1.874
-5.13%
1 gen 2005 anni
64.986
+30.368
87.73%
1 gen 2006 anni
57.082
-7.904
-12.16%
1 gen 2007 anni
58.972
+1.89
3.31%
1 gen 2008 anni
81.261
+22.289
37.8%
1 gen 2009 anni
141.117
+59.855
73.66%
1 gen 2010 anni
115.886
-25.231
-17.88%
1 gen 2011 anni
103.766
-12.12
-10.46%
1 gen 2012 anni
100.603
-3.163
-3.05%
1 gen 2013 anni
74.358
-26.245
-26.09%
1 gen 2014 anni
98.356
+23.998
32.27%
1 gen 2015 anni
108.956
+10.599
10.78%
1 gen 2016 anni
278.112
+169.156
155.25%
Classificazione dei paesi secondo i statistiche attuali per anni


Commenti: