29
/it/
it
AIzaSyAYiBZKx7MnpbEhh9jyipgxe19OcubqV5w
April 1, 2024
277153
United States
USA
true
2
1
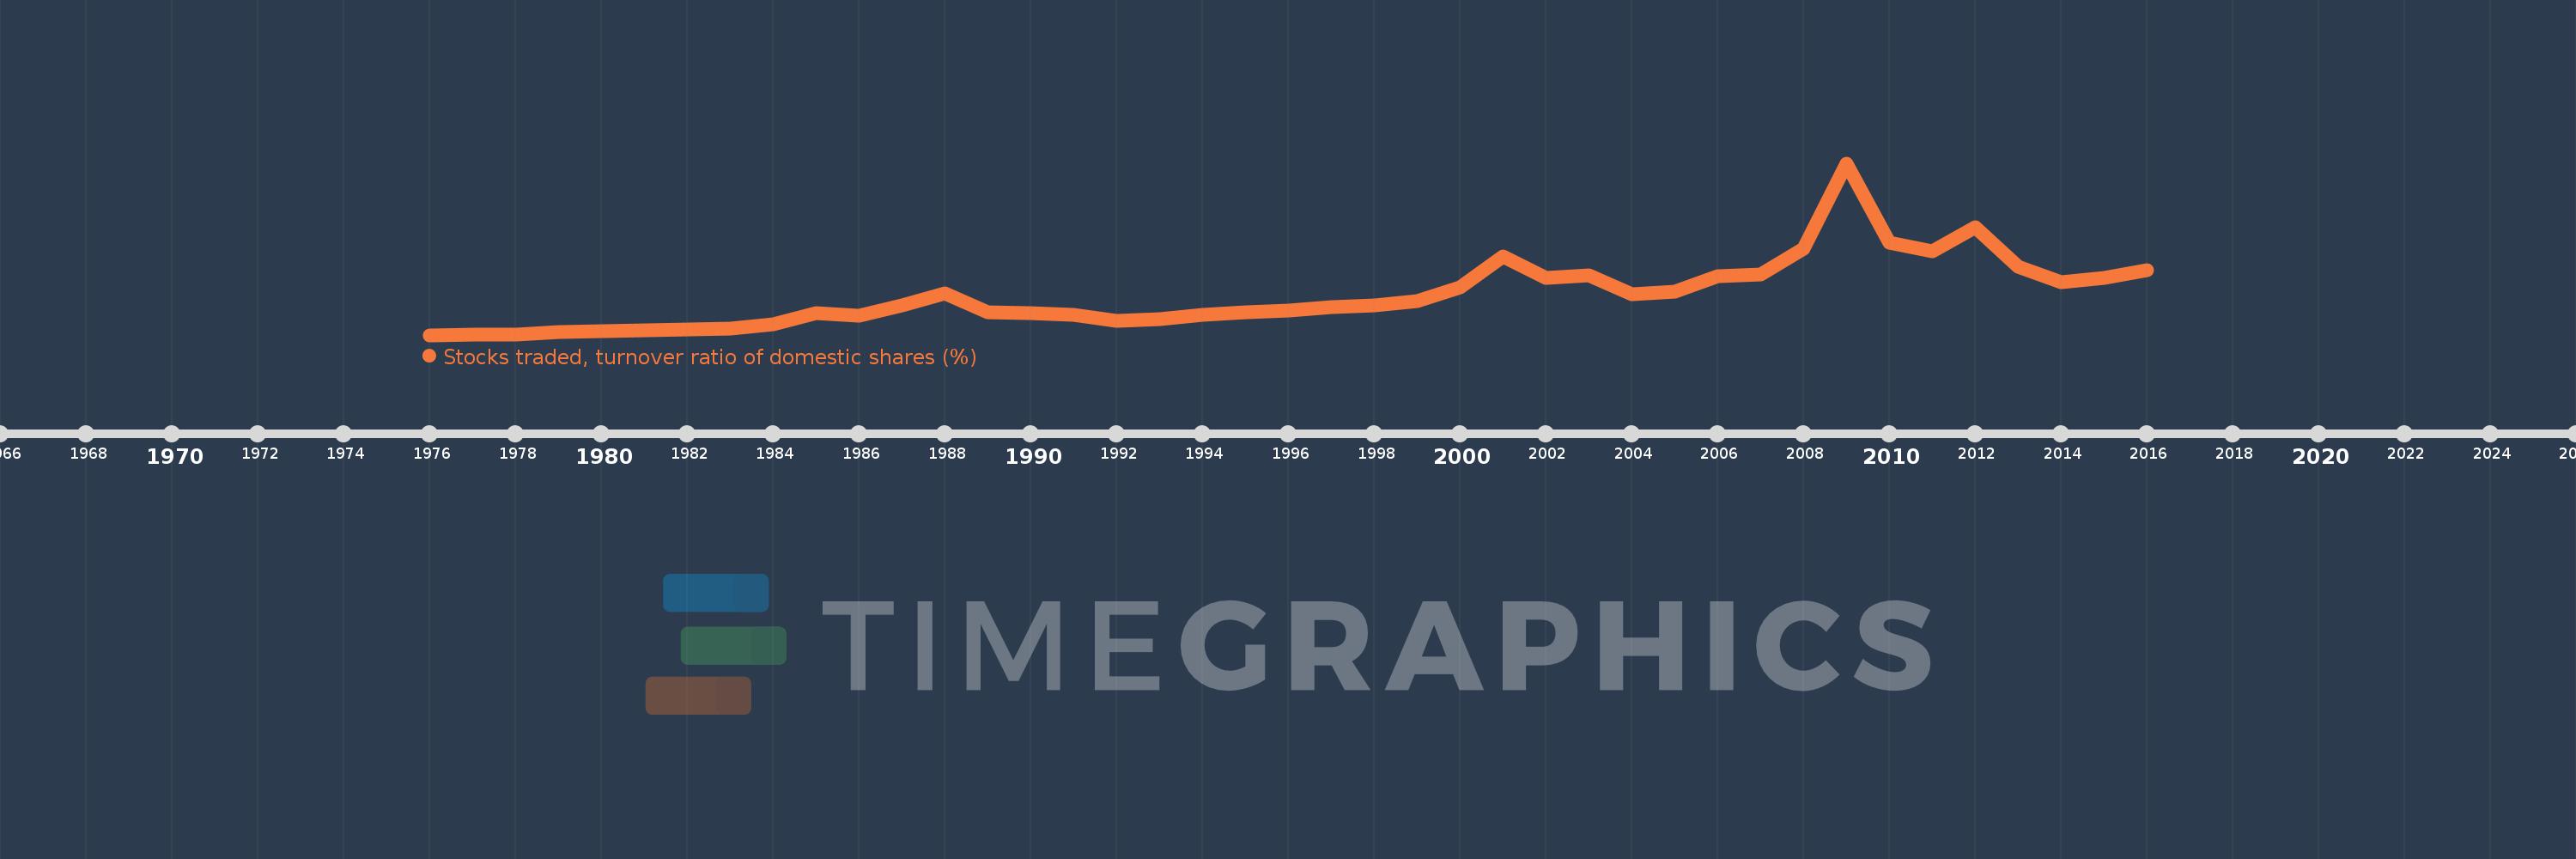
Stocks traded, turnover ratio of domestic shares (%)
2016,2015,2014,2013,2012,2011,2010,2009,2008,2007,2006,2005,2004,2003,2002,2001,2000,1999,1998,1997,1996,1995,1994,1993,1992,1991,1990,1989,1988,1987,1986,1985,1984,1983,1982,1981,1980,1979,1978,1977,1976
Queste statistiche in altri paesi:
Linea del tempo:
Questa scala temporale mostra un grafico dal 1976 anno al 2016 anno. United States. I dati fino ad 1975 anno non disponibili. Il numero di osservazioni attuali secondo i date: 41.
La fonte (nome):
Indicatori dello sviluppo mondiale
La fonte (organizzazione):
World Federation of Exchanges database.
Categorie:
Financial Sector
sono stati aggiornati
23 apr 2017 anni
Indicatori delle variazioni dei valori per anni
Minima:
19.506
1 gen 1976 anni
Massimo:
407.63
1 gen 2009 anni
Alla data di osservazione
Valore
Variazione assoluta
La variazione rispetto al valore precedente
1 gen 1976 anni
19.506
+19.506
0.0%
1 gen 1977 anni
19.626
+0.121
0.62%
1 gen 1978 anni
19.883
+0.257
1.31%
1 gen 1979 anni
26.201
+6.318
31.77%
1 gen 1980 anni
27.36
+1.159
4.42%
1 gen 1981 anni
30.138
+2.778
10.15%
1 gen 1982 anni
32.904
+2.766
9.18%
1 gen 1983 anni
34.879
+1.975
6.0%
1 gen 1984 anni
44.063
+9.184
26.33%
1 gen 1985 anni
69.183
+25.119
57.01%
1 gen 1986 anni
63.836
-5.347
-7.73%
1 gen 1987 anni
85.964
+22.128
34.66%
1 gen 1988 anni
113.635
+27.67
32.19%
1 gen 1989 anni
70.689
-42.946
-37.79%
1 gen 1990 anni
69.231
-1.457
-2.06%
1 gen 1991 anni
65.69
-3.541
-5.11%
1 gen 1992 anni
51.444
-14.247
-21.69%
1 gen 1993 anni
55.665
+4.222
8.21%
1 gen 1994 anni
65.404
+9.739
17.5%
1 gen 1995 anni
71.018
+5.615
8.58%
1 gen 1996 anni
74.491
+3.472
4.89%
1 gen 1997 anni
82.135
+7.645
10.26%
1 gen 1998 anni
86.03
+3.894
4.74%
1 gen 1999 anni
95.223
+9.193
10.69%
1 gen 2000 anni
127.328
+32.105
33.72%
1 gen 2001 anni
197.131
+69.803
54.82%
1 gen 2002 anni
149.343
-47.788
-24.24%
1 gen 2003 anni
154.263
+4.92
3.29%
1 gen 2004 anni
112.469
-41.794
-27.09%
1 gen 2005 anni
117.027
+4.558
4.05%
1 gen 2006 anni
151.711
+34.684
29.64%
1 gen 2007 anni
156.277
+4.566
3.01%
1 gen 2008 anni
215.099
+58.822
37.64%
1 gen 2009 anni
407.63
+192.532
89.51%
1 gen 2010 anni
227.537
-180.094
-44.18%
1 gen 2011 anni
208.439
-19.098
-8.39%
1 gen 2012 anni
262.428
+53.989
25.9%
1 gen 2013 anni
173.285
-89.142
-33.97%
1 gen 2014 anni
138.329
-34.956
-20.17%
1 gen 2015 anni
148.028
+9.699
7.01%
1 gen 2016 anni
165.148
+17.12
11.57%
Classificazione dei paesi secondo i statistiche attuali per anni


Commenti: