29
/it/
it
AIzaSyAYiBZKx7MnpbEhh9jyipgxe19OcubqV5w
April 1, 2024
26930
Early-demographic dividend
EAR
false
2
1
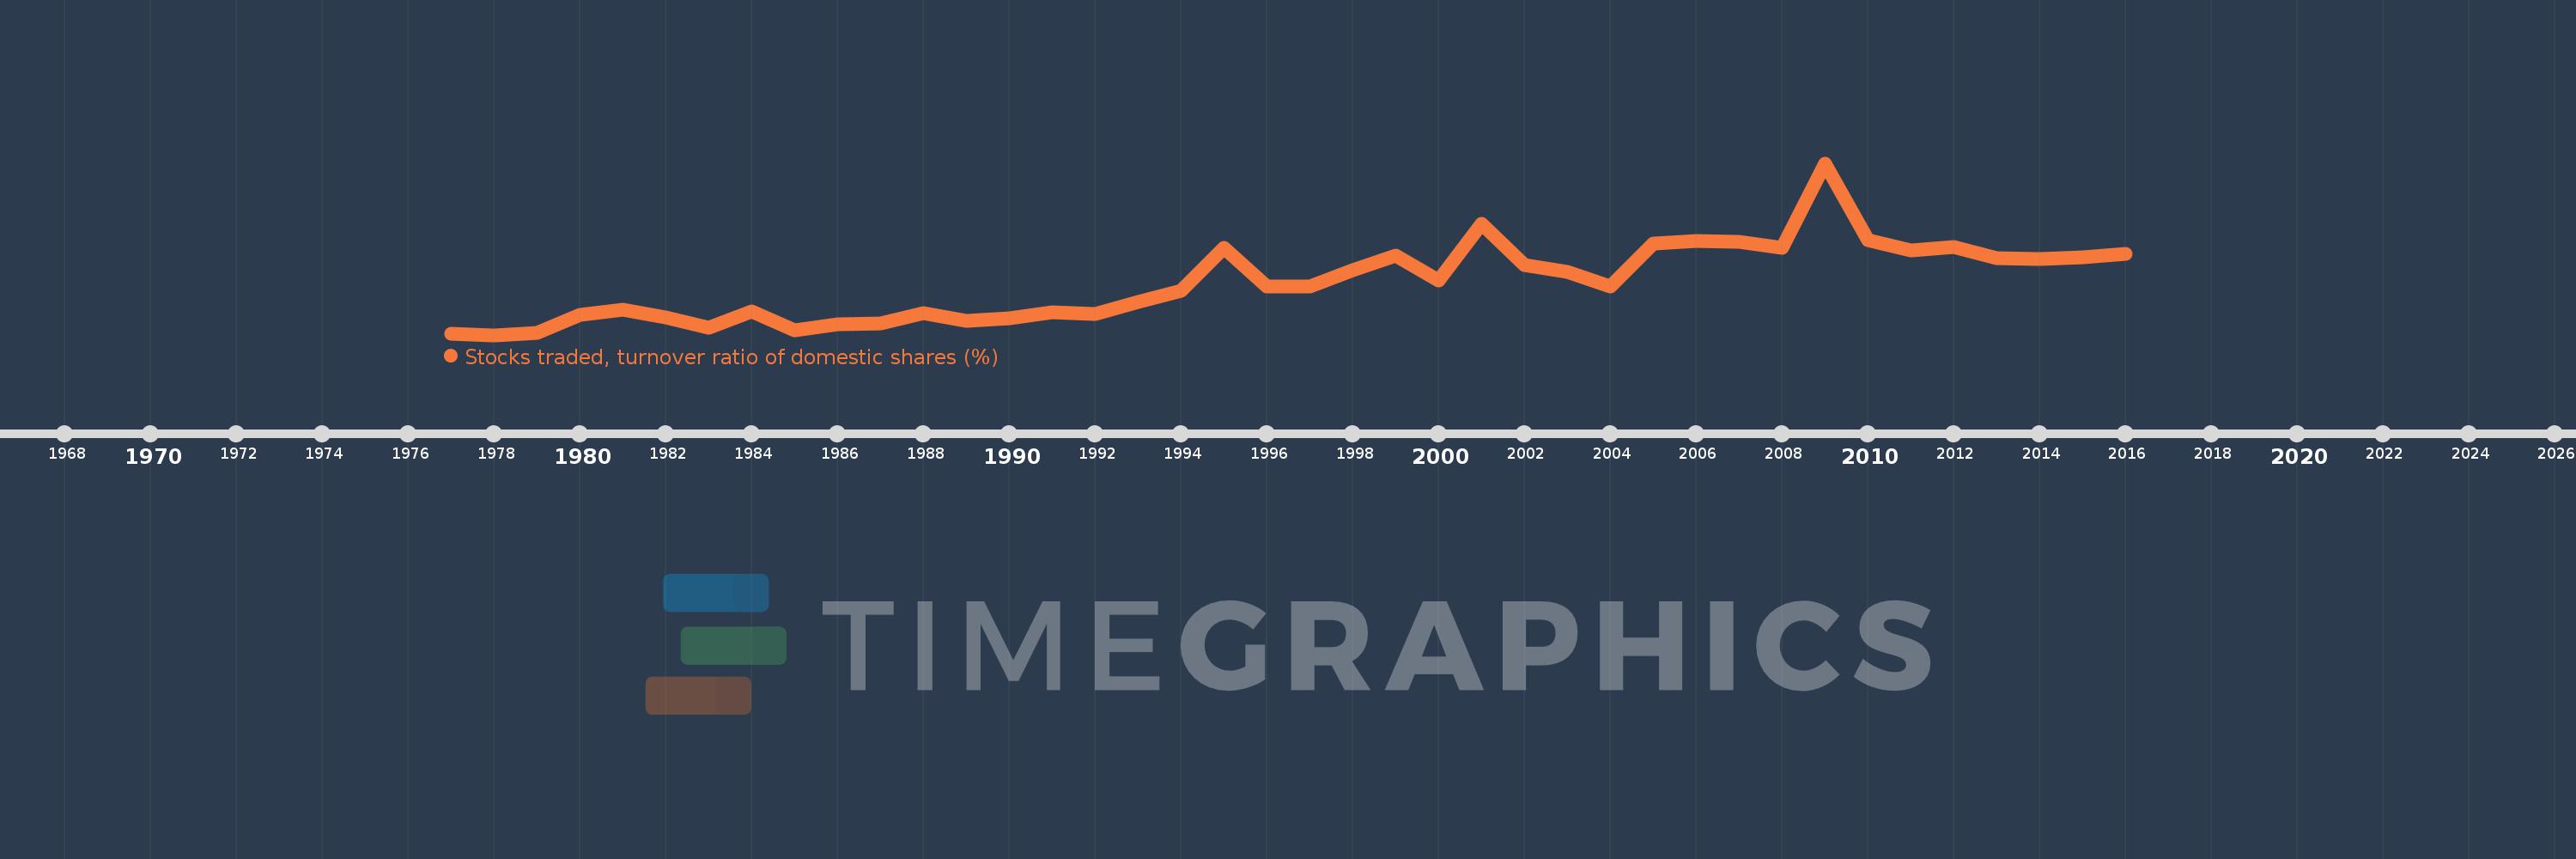
Stocks traded, turnover ratio of domestic shares (%)
2016,2015,2014,2013,2012,2011,2010,2009,2008,2007,2006,2005,2004,2003,2002,2001,2000,1999,1998,1997,1996,1995,1994,1993,1992,1991,1990,1989,1988,1987,1986,1985,1984,1983,1982,1981,1980,1979,1978,1977
Queste statistiche in altri paesi:
Linea del tempo:
Questa scala temporale mostra un grafico dal 1977 anno al 2016 anno. Early-demographic dividend. I dati fino ad 1976 anno non disponibili. Il numero di osservazioni attuali secondo i date: 40.
La fonte (nome):
Indicatori dello sviluppo mondiale
La fonte (organizzazione):
World Federation of Exchanges database.
Categorie:
Financial Sector
sono stati aggiornati
23 apr 2017 anni
Indicatori delle variazioni dei valori per anni
Minima:
3.726
1 gen 1978 anni
Massimo:
95.897
1 gen 2009 anni
Alla data di osservazione
Valore
Variazione assoluta
La variazione rispetto al valore precedente
1 gen 1977 anni
4.377
+4.377
0.0%
1 gen 1978 anni
3.726
-0.651
-14.87%
1 gen 1979 anni
4.893
+1.167
31.32%
1 gen 1980 anni
14.735
+9.842
201.16%
1 gen 1981 anni
17.205
+2.47
16.76%
1 gen 1982 anni
13.326
-3.879
-22.55%
1 gen 1983 anni
7.652
-5.674
-42.58%
1 gen 1984 anni
16.191
+8.539
111.6%
1 gen 1985 anni
6.208
-9.983
-61.66%
1 gen 1986 anni
9.526
+3.318
53.45%
1 gen 1987 anni
10.119
+0.593
6.22%
1 gen 1988 anni
15.327
+5.208
51.47%
1 gen 1989 anni
11.472
-3.855
-25.15%
1 gen 1990 anni
12.567
+1.095
9.54%
1 gen 1991 anni
15.992
+3.425
27.25%
1 gen 1992 anni
15.097
-0.894
-5.59%
1 gen 1993 anni
21.317
+6.22
41.2%
1 gen 1994 anni
27.33
+6.013
28.21%
1 gen 1995 anni
50.277
+22.947
83.96%
1 gen 1996 anni
29.967
-20.311
-40.4%
1 gen 1997 anni
29.555
-0.412
-1.37%
1 gen 1998 anni
38.636
+9.082
30.73%
1 gen 1999 anni
46.428
+7.792
20.17%
1 gen 2000 anni
32.896
-13.532
-29.15%
1 gen 2001 anni
63.188
+30.292
92.08%
1 gen 2002 anni
41.355
-21.833
-34.55%
1 gen 2003 anni
37.643
-3.712
-8.98%
1 gen 2004 anni
29.766
-7.878
-20.93%
1 gen 2005 anni
52.591
+22.826
76.69%
1 gen 2006 anni
54.412
+1.82
3.46%
1 gen 2007 anni
53.744
-0.668
-1.23%
1 gen 2008 anni
50.332
-3.412
-6.35%
1 gen 2009 anni
95.897
+45.564
90.53%
1 gen 2010 anni
54.786
-41.111
-42.87%
1 gen 2011 anni
48.996
-5.79
-10.57%
1 gen 2012 anni
50.734
+1.739
3.55%
1 gen 2013 anni
44.796
-5.938
-11.7%
1 gen 2014 anni
44.447
-0.349
-0.78%
1 gen 2015 anni
45.598
+1.151
2.59%
1 gen 2016 anni
47.495
+1.897
4.16%
Classificazione dei paesi secondo i statistiche attuali per anni


Commenti: