29
/it/
it
AIzaSyAYiBZKx7MnpbEhh9jyipgxe19OcubqV5w
April 1, 2024
33887
European Union
EUU
false
2
1
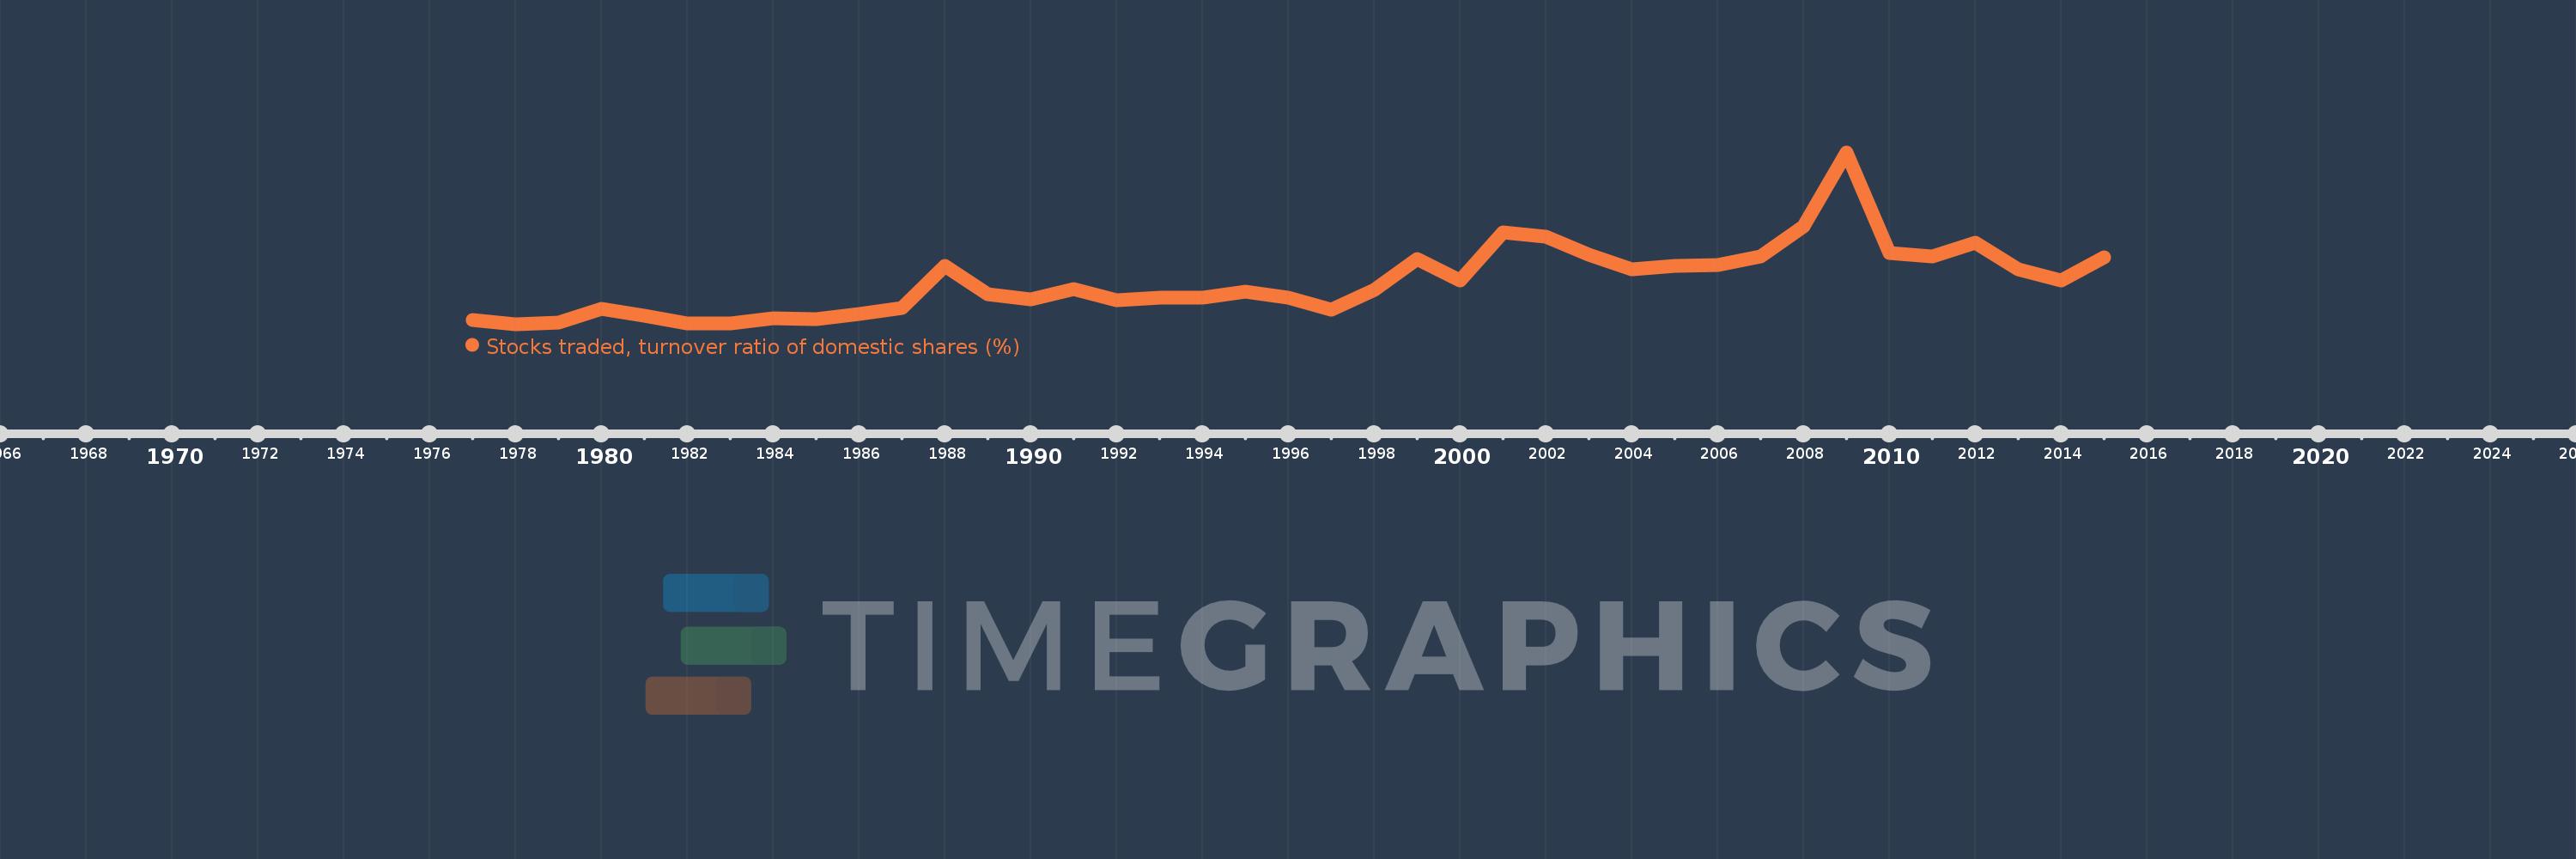
Stocks traded, turnover ratio of domestic shares (%)
2015,2014,2013,2012,2011,2010,2009,2008,2007,2006,2005,2004,2003,2002,2001,2000,1999,1998,1997,1996,1995,1994,1993,1992,1991,1990,1989,1988,1987,1986,1985,1984,1983,1982,1981,1980,1979,1978,1977
Queste statistiche in altri paesi:
Linea del tempo:
Questa scala temporale mostra un grafico dal 1977 anno al 2015 anno. European Union. I dati fino ad 1976 anno non disponibili. Il numero di osservazioni attuali secondo i date: 39.
La fonte (nome):
Indicatori dello sviluppo mondiale
La fonte (organizzazione):
World Federation of Exchanges database.
Categorie:
Financial Sector
sono stati aggiornati
23 apr 2017 anni
Indicatori delle variazioni dei valori per anni
Minima:
16.284
1 gen 1978 anni
Massimo:
196.166
1 gen 2009 anni
Alla data di osservazione
Valore
Variazione assoluta
La variazione rispetto al valore precedente
1 gen 1977 anni
20.379
+20.379
0.0%
1 gen 1978 anni
16.284
-4.095
-20.1%
1 gen 1979 anni
17.545
+1.261
7.75%
1 gen 1980 anni
32.253
+14.708
83.83%
1 gen 1981 anni
25.562
-6.692
-20.75%
1 gen 1982 anni
17.161
-8.401
-32.86%
1 gen 1983 anni
17.478
+0.317
1.85%
1 gen 1984 anni
22.394
+4.916
28.13%
1 gen 1985 anni
21.879
-0.514
-2.3%
1 gen 1986 anni
26.555
+4.676
21.37%
1 gen 1987 anni
33.084
+6.529
24.59%
1 gen 1988 anni
77.485
+44.401
134.21%
1 gen 1989 anni
47.754
-29.732
-38.37%
1 gen 1990 anni
42.029
-5.724
-11.99%
1 gen 1991 anni
52.78
+10.751
25.58%
1 gen 1992 anni
41.547
-11.233
-21.28%
1 gen 1993 anni
44.214
+2.667
6.42%
1 gen 1994 anni
44.279
+0.065
0.15%
1 gen 1995 anni
50.075
+5.796
13.09%
1 gen 1996 anni
43.984
-6.091
-12.16%
1 gen 1997 anni
31.741
-12.243
-27.83%
1 gen 1998 anni
51.977
+20.236
63.75%
1 gen 1999 anni
84.603
+32.626
62.77%
1 gen 2000 anni
61.88
-22.723
-26.86%
1 gen 2001 anni
112.197
+50.316
81.31%
1 gen 2002 anni
107.905
-4.292
-3.82%
1 gen 2003 anni
89.066
-18.839
-17.46%
1 gen 2004 anni
73.368
-15.699
-17.63%
1 gen 2005 anni
77.799
+4.432
6.04%
1 gen 2006 anni
77.819
+0.02
0.03%
1 gen 2007 anni
87.255
+9.436
12.13%
1 gen 2008 anni
118.296
+31.041
35.57%
1 gen 2009 anni
196.166
+77.87
65.83%
1 gen 2010 anni
90.652
-105.514
-53.79%
1 gen 2011 anni
87.296
-3.356
-3.7%
1 gen 2012 anni
101.955
+14.66
16.79%
1 gen 2013 anni
73.46
-28.495
-27.95%
1 gen 2014 anni
61.716
-11.745
-15.99%
1 gen 2015 anni
86.562
+24.847
40.26%
Classificazione dei paesi secondo i statistiche attuali per anni


Commenti: