29
/it/
it
AIzaSyAYiBZKx7MnpbEhh9jyipgxe19OcubqV5w
April 1, 2024
37810
IDA & IBRD total
IBT
false
2
1
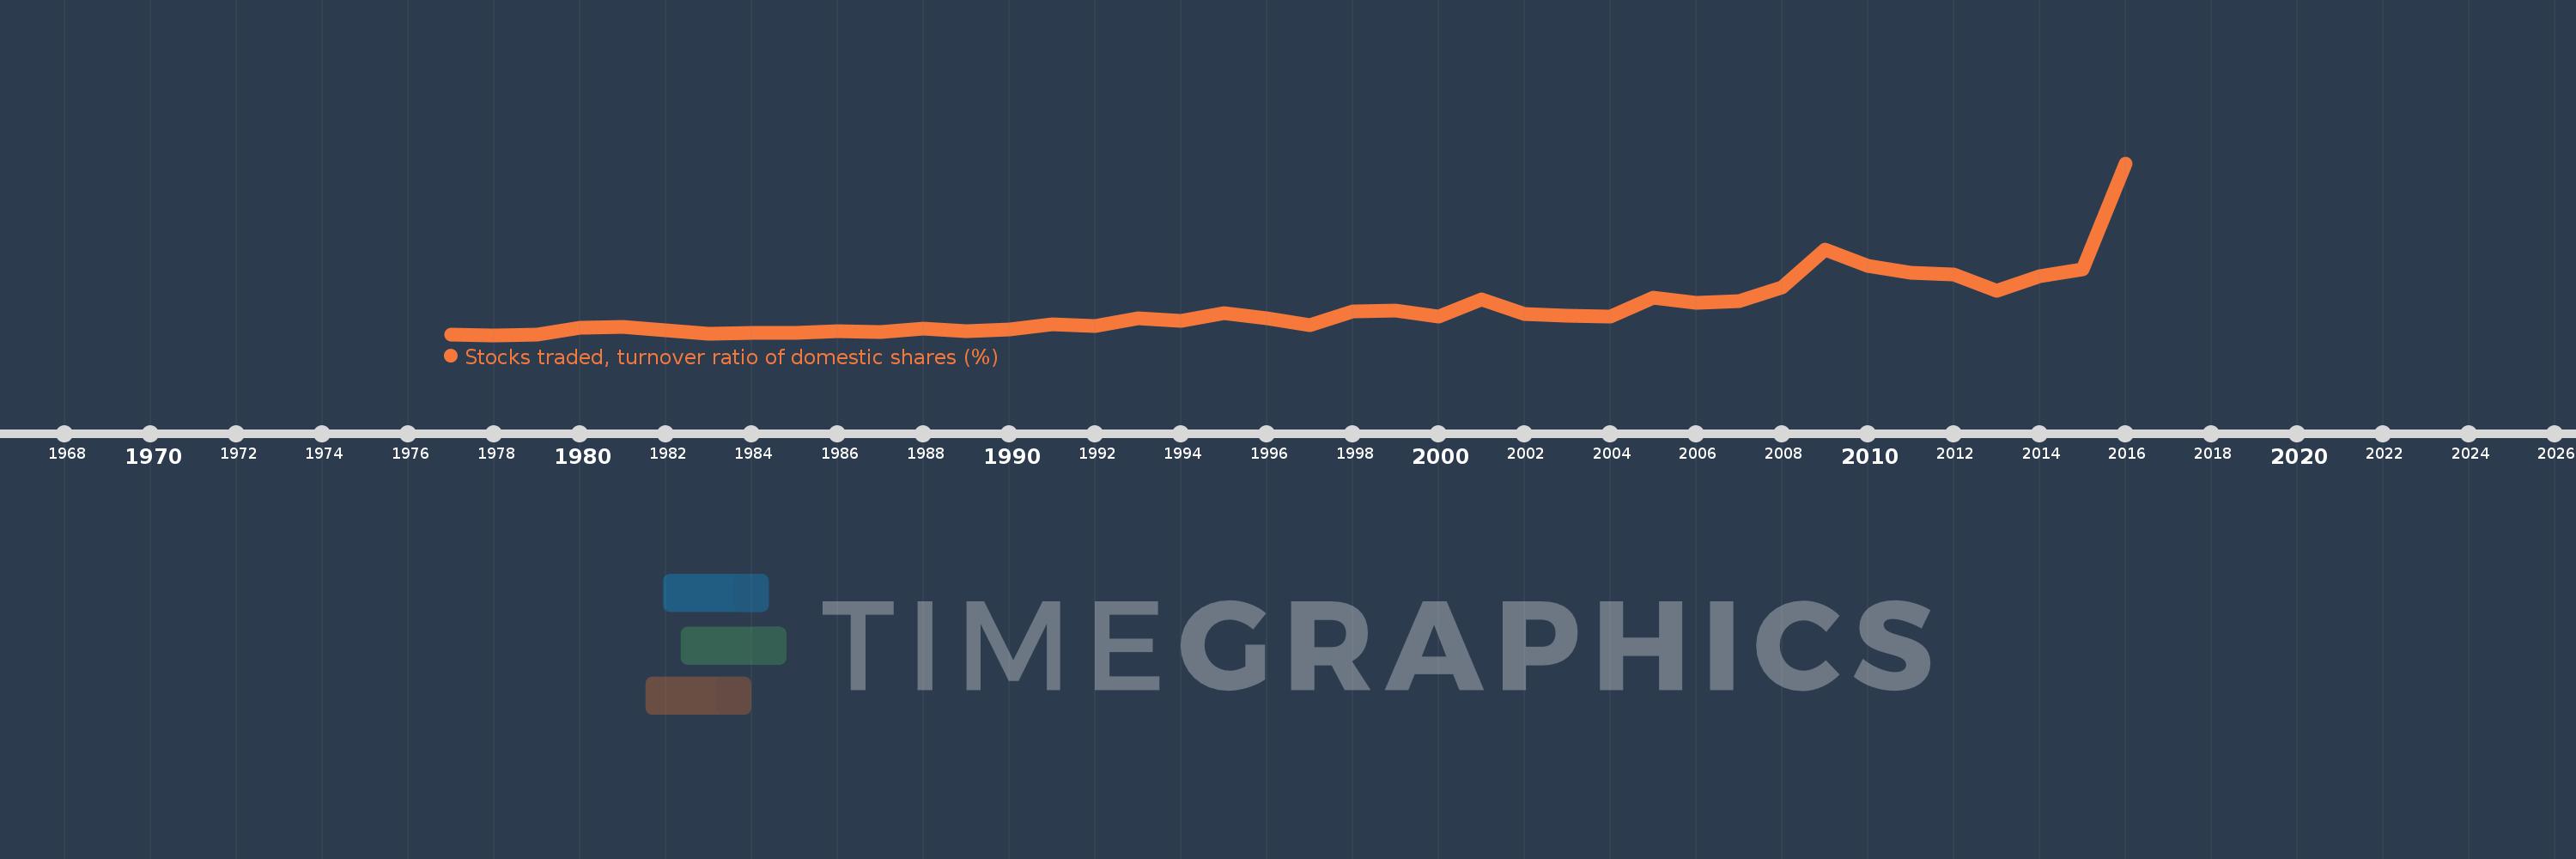
Stocks traded, turnover ratio of domestic shares (%)
2016,2015,2014,2013,2012,2011,2010,2009,2008,2007,2006,2005,2004,2003,2002,2001,2000,1999,1998,1997,1996,1995,1994,1993,1992,1991,1990,1989,1988,1987,1986,1985,1984,1983,1982,1981,1980,1979,1978,1977
Queste statistiche in altri paesi:
Linea del tempo:
Questa scala temporale mostra un grafico dal 1977 anno al 2016 anno. IDA & IBRD total. I dati fino ad 1976 anno non disponibili. Il numero di osservazioni attuali secondo i date: 40.
La fonte (nome):
Indicatori dello sviluppo mondiale
La fonte (organizzazione):
World Federation of Exchanges database.
Categorie:
Financial Sector
sono stati aggiornati
23 apr 2017 anni
Indicatori delle variazioni dei valori per anni
Minima:
3.726
1 gen 1978 anni
Massimo:
271.324
1 gen 2016 anni
Alla data di osservazione
Valore
Variazione assoluta
La variazione rispetto al valore precedente
1 gen 1977 anni
4.377
+4.377
0.0%
1 gen 1978 anni
3.726
-0.651
-14.87%
1 gen 1979 anni
4.893
+1.167
31.32%
1 gen 1980 anni
14.735
+9.842
201.16%
1 gen 1981 anni
16.063
+1.328
9.01%
1 gen 1982 anni
10.703
-5.359
-33.37%
1 gen 1983 anni
5.078
-5.626
-52.56%
1 gen 1984 anni
6.475
+1.398
27.53%
1 gen 1985 anni
7.078
+0.602
9.3%
1 gen 1986 anni
9.643
+2.565
36.24%
1 gen 1987 anni
8.776
-0.867
-8.99%
1 gen 1988 anni
14.109
+5.332
60.76%
1 gen 1989 anni
9.752
-4.356
-30.88%
1 gen 1990 anni
12.062
+2.31
23.68%
1 gen 1991 anni
20.963
+8.901
73.8%
1 gen 1992 anni
17.413
-3.551
-16.94%
1 gen 1993 anni
29.782
+12.369
71.04%
1 gen 1994 anni
25.277
-4.506
-15.13%
1 gen 1995 anni
38.093
+12.816
50.7%
1 gen 1996 anni
30.095
-7.998
-21.0%
1 gen 1997 anni
19.587
-10.508
-34.92%
1 gen 1998 anni
40.27
+20.683
105.6%
1 gen 1999 anni
41.408
+1.138
2.83%
1 gen 2000 anni
32.331
-9.077
-21.92%
1 gen 2001 anni
58.598
+26.267
81.24%
1 gen 2002 anni
37.035
-21.563
-36.8%
1 gen 2003 anni
33.541
-3.494
-9.43%
1 gen 2004 anni
32.307
-1.235
-3.68%
1 gen 2005 anni
61.537
+29.231
90.48%
1 gen 2006 anni
54.313
-7.224
-11.74%
1 gen 2007 anni
56.528
+2.215
4.08%
1 gen 2008 anni
78.583
+22.055
39.02%
1 gen 2009 anni
136.312
+57.729
73.46%
1 gen 2010 anni
111.719
-24.593
-18.04%
1 gen 2011 anni
100.351
-11.368
-10.18%
1 gen 2012 anni
97.56
-2.791
-2.78%
1 gen 2013 anni
72.169
-25.391
-26.03%
1 gen 2014 anni
95.213
+23.044
31.93%
1 gen 2015 anni
105.871
+10.658
11.19%
1 gen 2016 anni
271.324
+165.452
156.28%
Classificazione dei paesi secondo i statistiche attuali per anni


Commenti: