29
/it/
it
AIzaSyAYiBZKx7MnpbEhh9jyipgxe19OcubqV5w
April 1, 2024
170518
Korea, Rep.
KOR
true
2
1
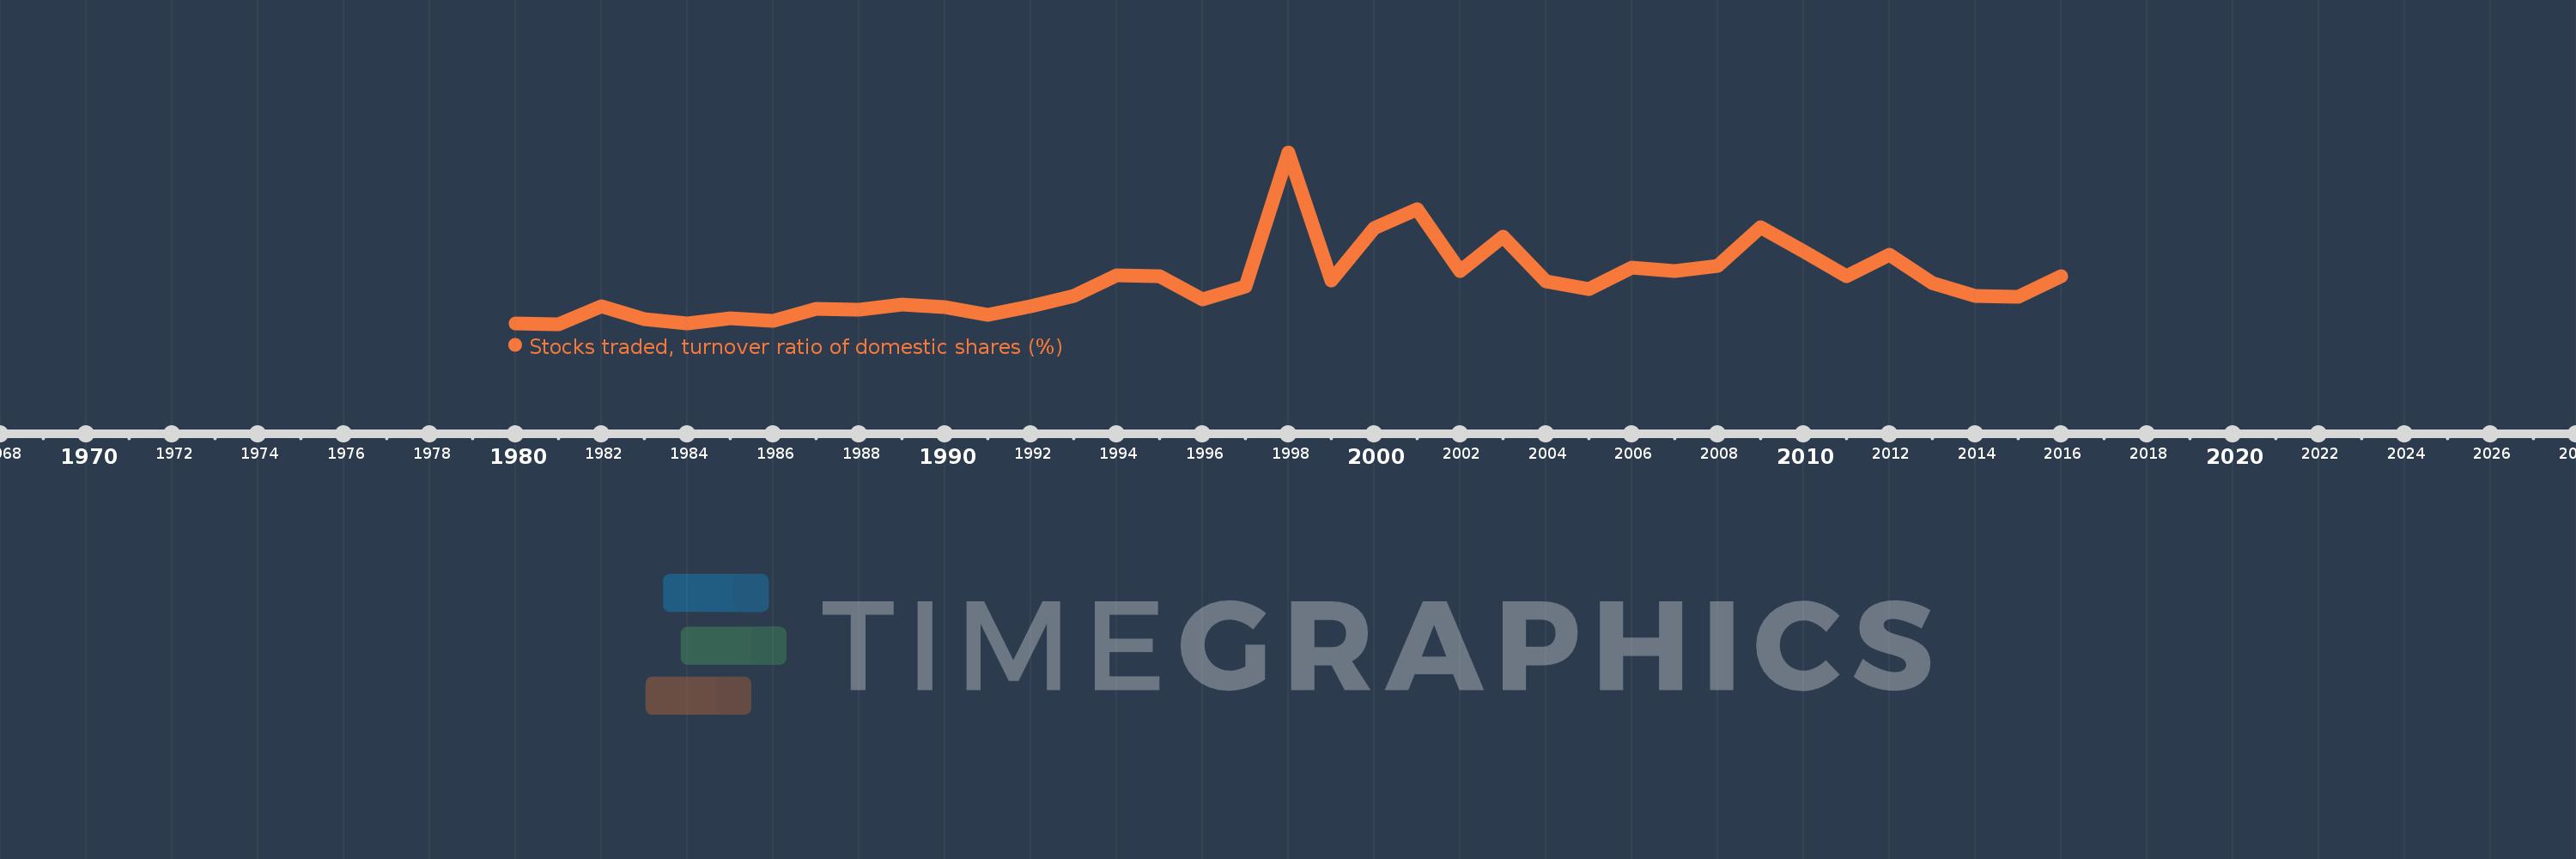
Stocks traded, turnover ratio of domestic shares (%)
2016,2015,2014,2013,2012,2011,2010,2009,2008,2007,2006,2005,2004,2003,2002,2001,2000,1999,1998,1997,1996,1995,1994,1993,1992,1991,1990,1989,1988,1987,1986,1985,1984,1983,1982,1981,1980
Queste statistiche in altri paesi:
Linea del tempo:
Questa scala temporale mostra un grafico dal 1980 anno al 2016 anno. Korea, Rep.. I dati fino ad 1979 anno non disponibili. Il numero di osservazioni attuali secondo i date: 37.
La fonte (nome):
Indicatori dello sviluppo mondiale
La fonte (organizzazione):
World Federation of Exchanges database.
Categorie:
Financial Sector
sono stati aggiornati
23 apr 2017 anni
Indicatori delle variazioni dei valori per anni
Minima:
48.744
1 gen 1981 anni
Massimo:
407.88
1 gen 1998 anni
Alla data di osservazione
Valore
Variazione assoluta
La variazione rispetto al valore precedente
1 gen 1980 anni
50.08
+50.08
0.0%
1 gen 1981 anni
48.744
-1.336
-2.67%
1 gen 1982 anni
85.641
+36.897
75.69%
1 gen 1983 anni
59.794
-25.847
-30.18%
1 gen 1984 anni
50.222
-9.572
-16.01%
1 gen 1985 anni
60.566
+10.344
20.6%
1 gen 1986 anni
55.105
-5.461
-9.02%
1 gen 1987 anni
80.022
+24.917
45.22%
1 gen 1988 anni
78.304
-1.718
-2.15%
1 gen 1989 anni
90.049
+11.744
15.0%
1 gen 1990 anni
85.046
-5.002
-5.55%
1 gen 1991 anni
67.648
-17.399
-20.46%
1 gen 1992 anni
85.567
+17.92
26.49%
1 gen 1993 anni
106.98
+21.412
25.02%
1 gen 1994 anni
150.833
+43.854
40.99%
1 gen 1995 anni
149.563
-1.27
-0.84%
1 gen 1996 anni
101.249
-48.314
-32.3%
1 gen 1997 anni
127.591
+26.342
26.02%
1 gen 1998 anni
407.88
+280.29
219.68%
1 gen 1999 anni
139.947
-267.933
-65.69%
1 gen 2000 anni
249.793
+109.845
78.49%
1 gen 2001 anni
289.244
+39.451
15.79%
1 gen 2002 anni
159.889
-129.355
-44.72%
1 gen 2003 anni
231.737
+71.847
44.94%
1 gen 2004 anni
138.778
-92.959
-40.11%
1 gen 2005 anni
122.763
-16.015
-11.54%
1 gen 2006 anni
167.089
+44.327
36.11%
1 gen 2007 anni
160.506
-6.583
-3.94%
1 gen 2008 anni
170.842
+10.336
6.44%
1 gen 2009 anni
252.173
+81.33
47.61%
1 gen 2010 anni
201.949
-50.224
-19.92%
1 gen 2011 anni
149.257
-52.692
-26.09%
1 gen 2012 anni
194.19
+44.933
30.1%
1 gen 2013 anni
134.361
-59.83
-30.81%
1 gen 2014 anni
107.72
-26.641
-19.83%
1 gen 2015 anni
105.849
-1.87
-1.74%
1 gen 2016 anni
149.751
+43.901
41.48%
Classificazione dei paesi secondo i statistiche attuali per anni


Commenti: