29
/it/
it
AIzaSyAYiBZKx7MnpbEhh9jyipgxe19OcubqV5w
April 1, 2024
182582
Luxembourg
LUX
true
2
1
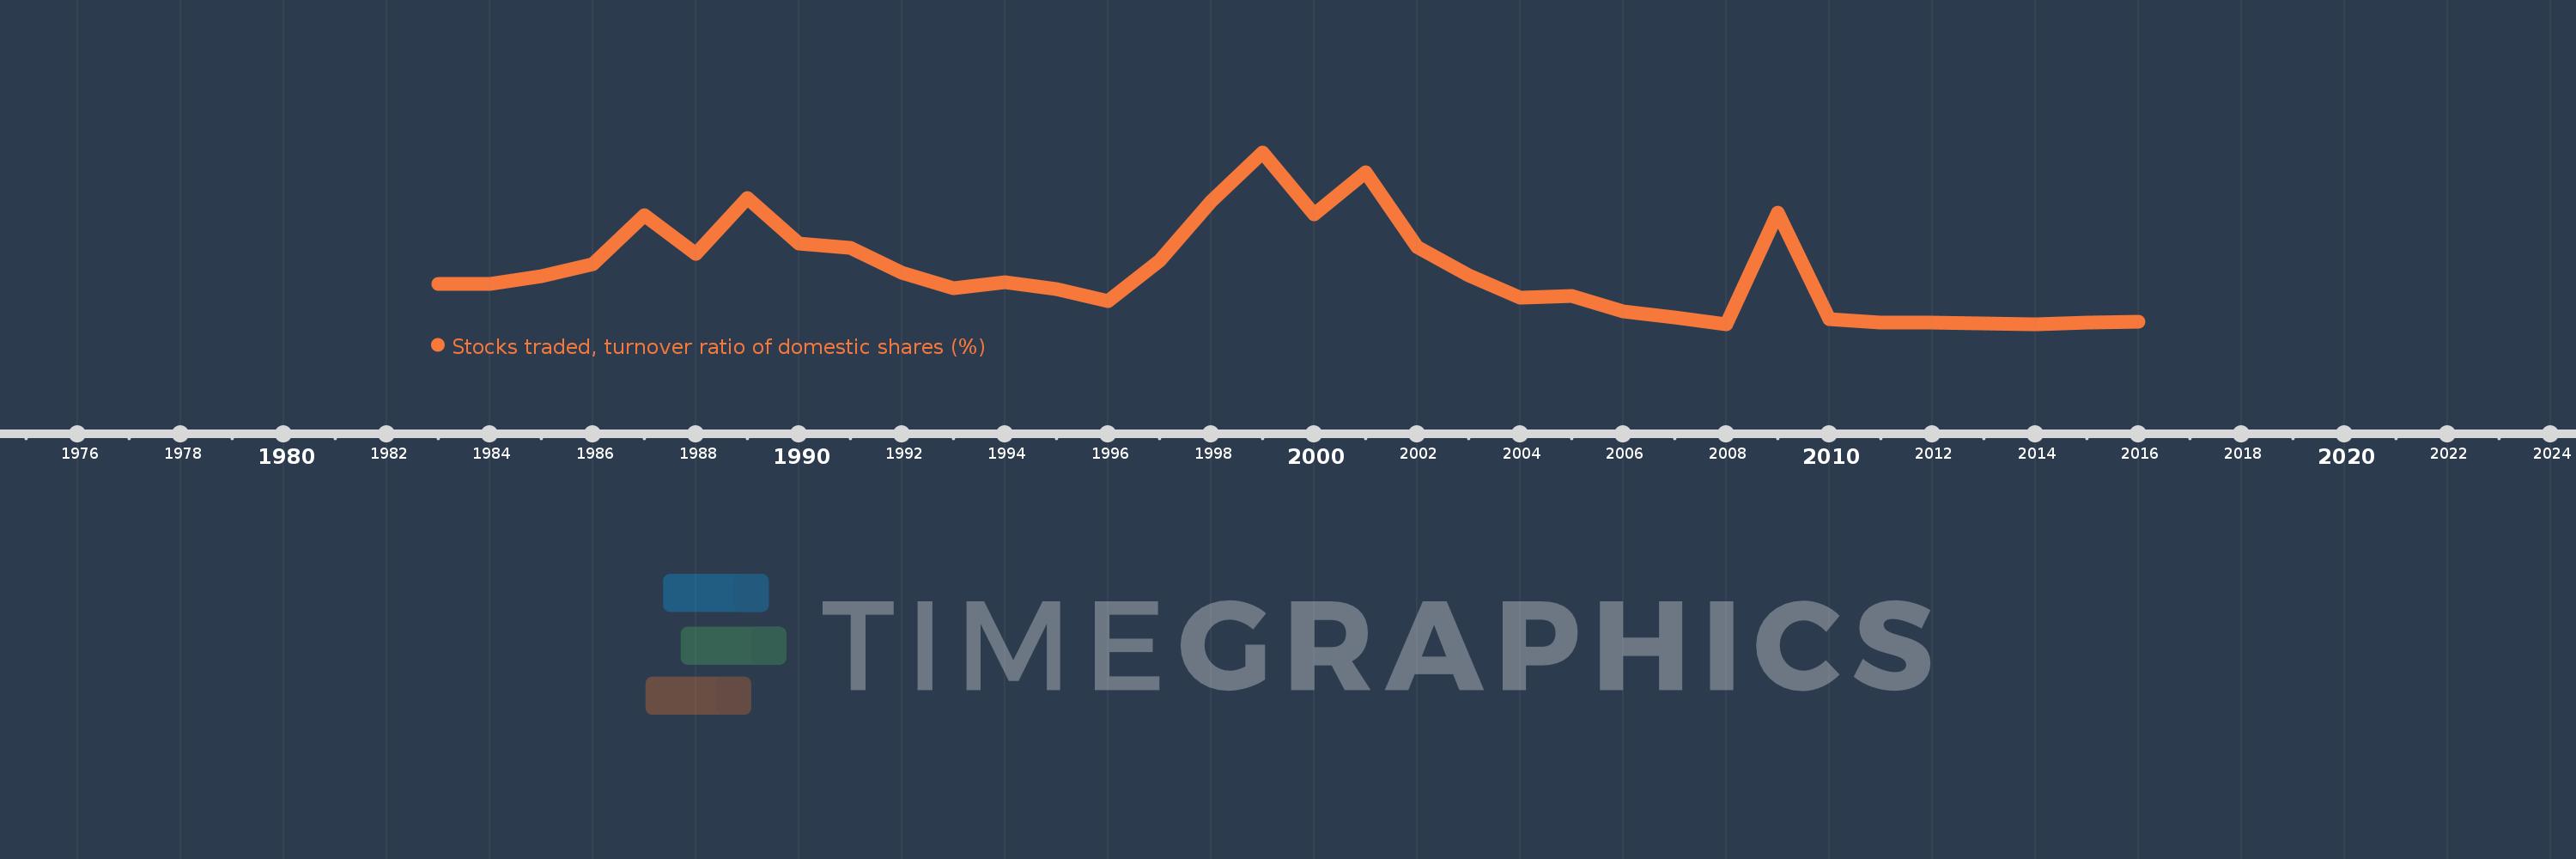
Stocks traded, turnover ratio of domestic shares (%)
2016,2015,2014,2013,2012,2011,2010,2009,2008,2007,2006,2005,2004,2003,2002,2001,2000,1999,1998,1997,1996,1995,1994,1993,1992,1991,1990,1989,1988,1987,1986,1985,1984,1983
Queste statistiche in altri paesi:
Linea del tempo:
Questa scala temporale mostra un grafico dal 1983 anno al 2016 anno. Luxembourg. I dati fino ad 1982 anno non disponibili. Il numero di osservazioni attuali secondo i date: 34.
La fonte (nome):
Indicatori dello sviluppo mondiale
La fonte (organizzazione):
World Federation of Exchanges database.
Categorie:
Financial Sector
sono stati aggiornati
23 apr 2017 anni
Indicatori delle variazioni dei valori per anni
Minima:
0.147
1 gen 2008 anni
Massimo:
4.055
1 gen 1999 anni
Alla data di osservazione
Valore
Variazione assoluta
La variazione rispetto al valore precedente
1 gen 1983 anni
1.061
+1.061
0.0%
1 gen 1984 anni
1.059
-0.002
-0.2%
1 gen 1985 anni
1.244
+0.185
17.49%
1 gen 1986 anni
1.509
+0.265
21.27%
1 gen 1987 anni
2.635
+1.126
74.62%
1 gen 1988 anni
1.756
-0.879
-33.36%
1 gen 1989 anni
3.013
+1.257
71.58%
1 gen 1990 anni
1.976
-1.037
-34.41%
1 gen 1991 anni
1.887
-0.09
-4.54%
1 gen 1992 anni
1.308
-0.579
-30.69%
1 gen 1993 anni
0.965
-0.343
-26.19%
1 gen 1994 anni
1.094
+0.128
13.31%
1 gen 1995 anni
0.943
-0.151
-13.8%
1 gen 1996 anni
0.675
-0.268
-28.42%
1 gen 1997 anni
1.586
+0.911
135.06%
1 gen 1998 anni
2.938
+1.352
85.23%
1 gen 1999 anni
4.055
+1.117
38.03%
1 gen 2000 anni
2.647
-1.409
-34.74%
1 gen 2001 anni
3.594
+0.947
35.78%
1 gen 2002 anni
1.898
-1.696
-47.2%
1 gen 2003 anni
1.252
-0.646
-34.04%
1 gen 2004 anni
0.758
-0.494
-39.43%
1 gen 2005 anni
0.791
+0.033
4.31%
1 gen 2006 anni
0.442
-0.348
-44.06%
1 gen 2007 anni
0.302
-0.14
-31.66%
1 gen 2008 anni
0.147
-0.155
-51.4%
1 gen 2009 anni
2.688
+2.541
1.73 Mille.%
1 gen 2010 anni
0.267
-2.421
-90.05%
1 gen 2011 anni
0.176
-0.092
-34.24%
1 gen 2012 anni
0.181
+0.006
3.21%
1 gen 2013 anni
0.163
-0.018
-9.95%
1 gen 2014 anni
0.152
-0.011
-6.99%
1 gen 2015 anni
0.175
+0.023
15.03%
1 gen 2016 anni
0.204
+0.029
16.43%
Classificazione dei paesi secondo i statistiche attuali per anni


Commenti: