29
/it/
it
AIzaSyAYiBZKx7MnpbEhh9jyipgxe19OcubqV5w
April 1, 2024
101605
Canada
CAN
true
2
1
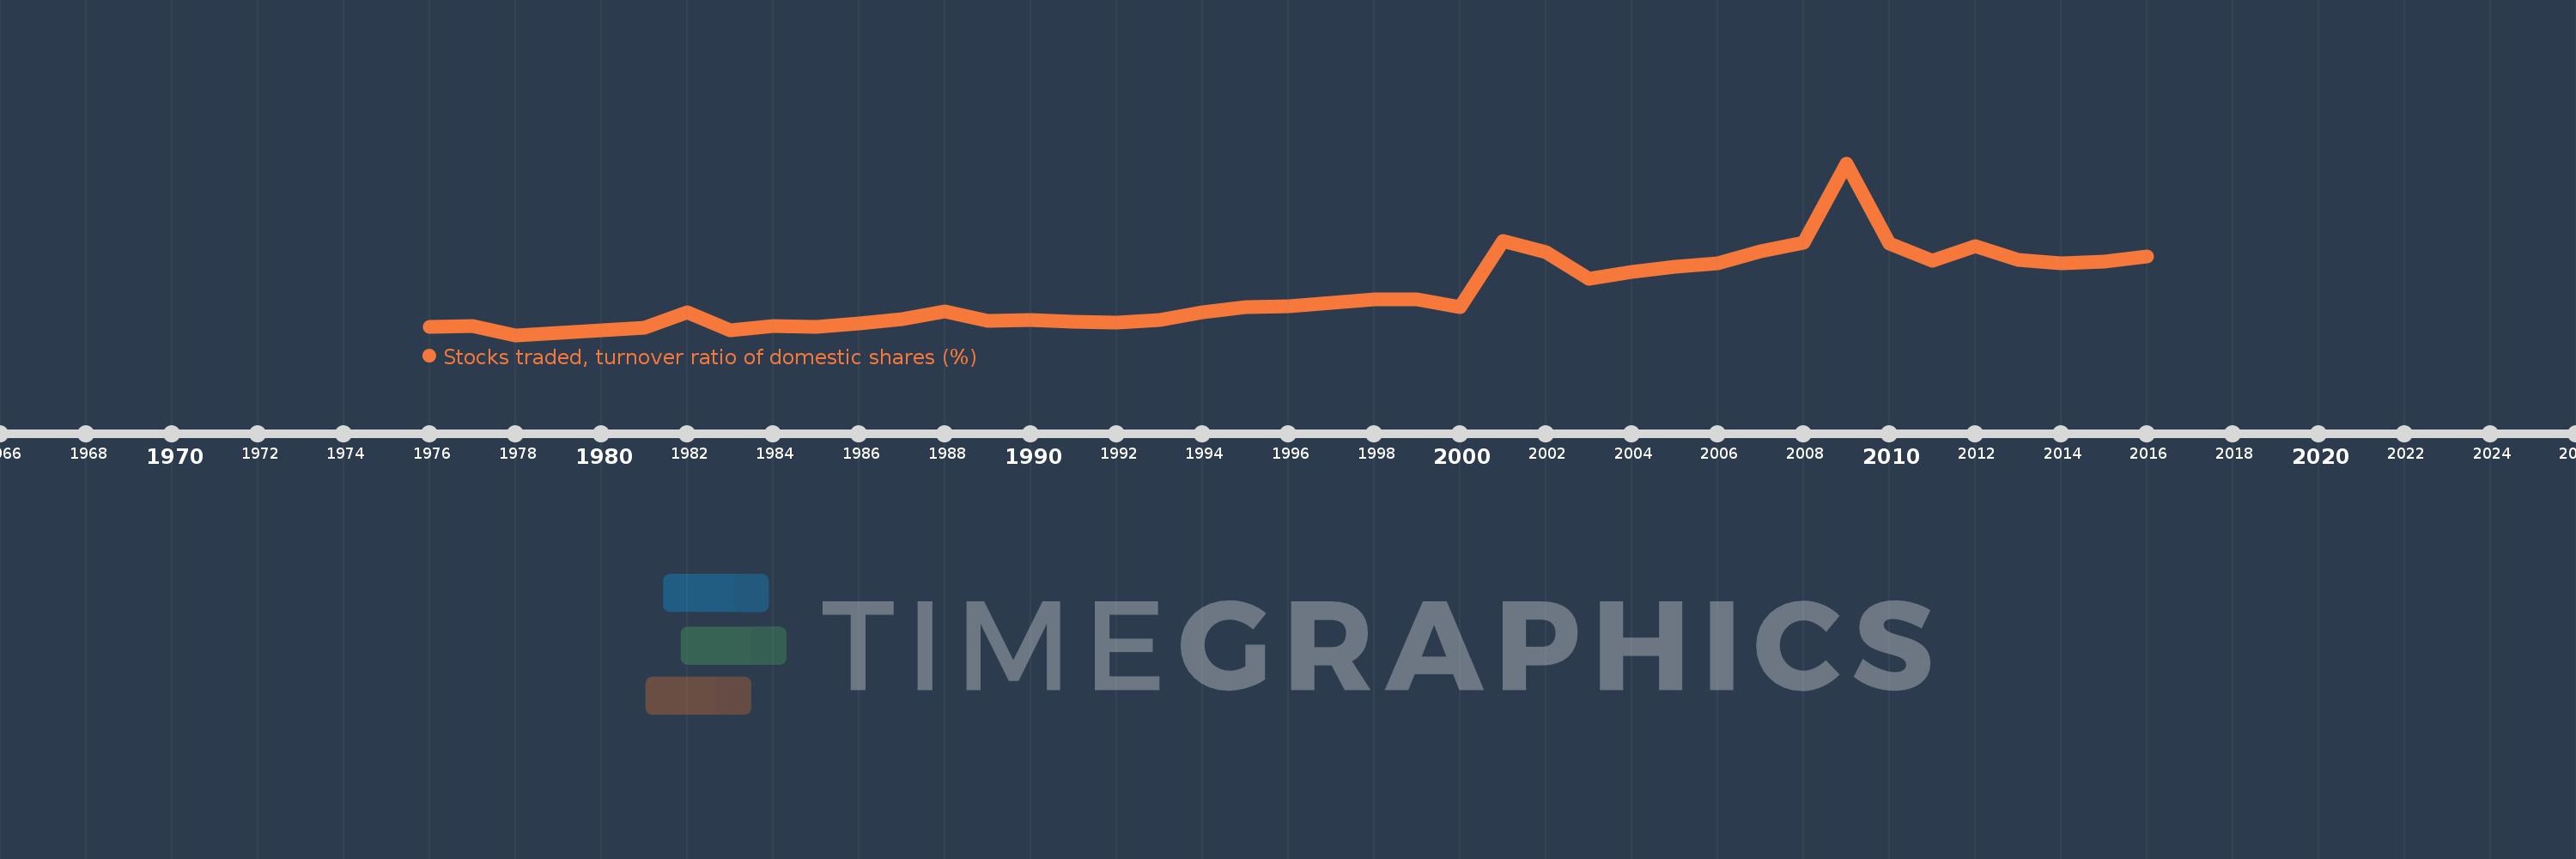
Stocks traded, turnover ratio of domestic shares (%)
2016,2015,2014,2013,2012,2011,2010,2009,2008,2007,2006,2005,2004,2003,2002,2001,2000,1999,1998,1997,1996,1995,1994,1993,1992,1991,1990,1989,1988,1987,1986,1985,1984,1983,1982,1981,1980,1979,1978,1977,1976
Queste statistiche in altri paesi:
Linea del tempo:
Questa scala temporale mostra un grafico dal 1976 anno al 2016 anno. Canada. I dati fino ad 1975 anno non disponibili. Il numero di osservazioni attuali secondo i date: 41.
La fonte (nome):
Indicatori dello sviluppo mondiale
La fonte (organizzazione):
World Federation of Exchanges database.
Categorie:
Financial Sector
sono stati aggiornati
23 apr 2017 anni
Indicatori delle variazioni dei valori per anni
Minima:
3.833
1 gen 1978 anni
Massimo:
145.4
1 gen 2009 anni
Alla data di osservazione
Valore
Variazione assoluta
La variazione rispetto al valore precedente
1 gen 1976 anni
10.274
+10.274
0.0%
1 gen 1977 anni
11.293
+1.018
9.91%
1 gen 1978 anni
3.833
-7.46
-66.06%
1 gen 1979 anni
5.654
+1.821
47.5%
1 gen 1980 anni
7.566
+1.912
33.82%
1 gen 1981 anni
9.505
+1.939
25.64%
1 gen 1982 anni
22.436
+12.931
136.05%
1 gen 1983 anni
7.952
-14.484
-64.56%
1 gen 1984 anni
10.934
+2.982
37.5%
1 gen 1985 anni
10.262
-0.672
-6.15%
1 gen 1986 anni
13.313
+3.052
29.74%
1 gen 1987 anni
16.974
+3.661
27.5%
1 gen 1988 anni
22.992
+6.018
35.45%
1 gen 1989 anni
15.393
-7.599
-33.05%
1 gen 1990 anni
16.448
+1.055
6.86%
1 gen 1991 anni
14.852
-1.596
-9.7%
1 gen 1992 anni
14.418
-0.434
-2.92%
1 gen 1993 anni
16.531
+2.113
14.66%
1 gen 1994 anni
22.394
+5.862
35.46%
1 gen 1995 anni
27.121
+4.728
21.11%
1 gen 1996 anni
27.303
+0.182
0.67%
1 gen 1997 anni
30.118
+2.816
10.31%
1 gen 1998 anni
33.444
+3.326
11.04%
1 gen 1999 anni
32.969
-0.475
-1.42%
1 gen 2000 anni
27.113
-5.856
-17.76%
1 gen 2001 anni
81.533
+54.42
200.71%
1 gen 2002 anni
72.481
-9.052
-11.1%
1 gen 2003 anni
50.464
-22.017
-30.38%
1 gen 2004 anni
55.651
+5.187
10.28%
1 gen 2005 anni
59.999
+4.348
7.81%
1 gen 2006 anni
62.888
+2.889
4.82%
1 gen 2007 anni
72.743
+9.855
15.67%
1 gen 2008 anni
79.806
+7.063
9.71%
1 gen 2009 anni
145.4
+65.594
82.19%
1 gen 2010 anni
79.461
-65.939
-45.35%
1 gen 2011 anni
64.71
-14.751
-18.56%
1 gen 2012 anni
77.06
+12.35
19.08%
1 gen 2013 anni
65.445
-11.615
-15.07%
1 gen 2014 anni
62.616
-2.829
-4.32%
1 gen 2015 anni
64.15
+1.534
2.45%
1 gen 2016 anni
68.801
+4.651
7.25%
Classificazione dei paesi secondo i statistiche attuali per anni


Commenti: