29
/it/
it
AIzaSyAYiBZKx7MnpbEhh9jyipgxe19OcubqV5w
April 1, 2024
141606
Greece
GRC
true
2
1
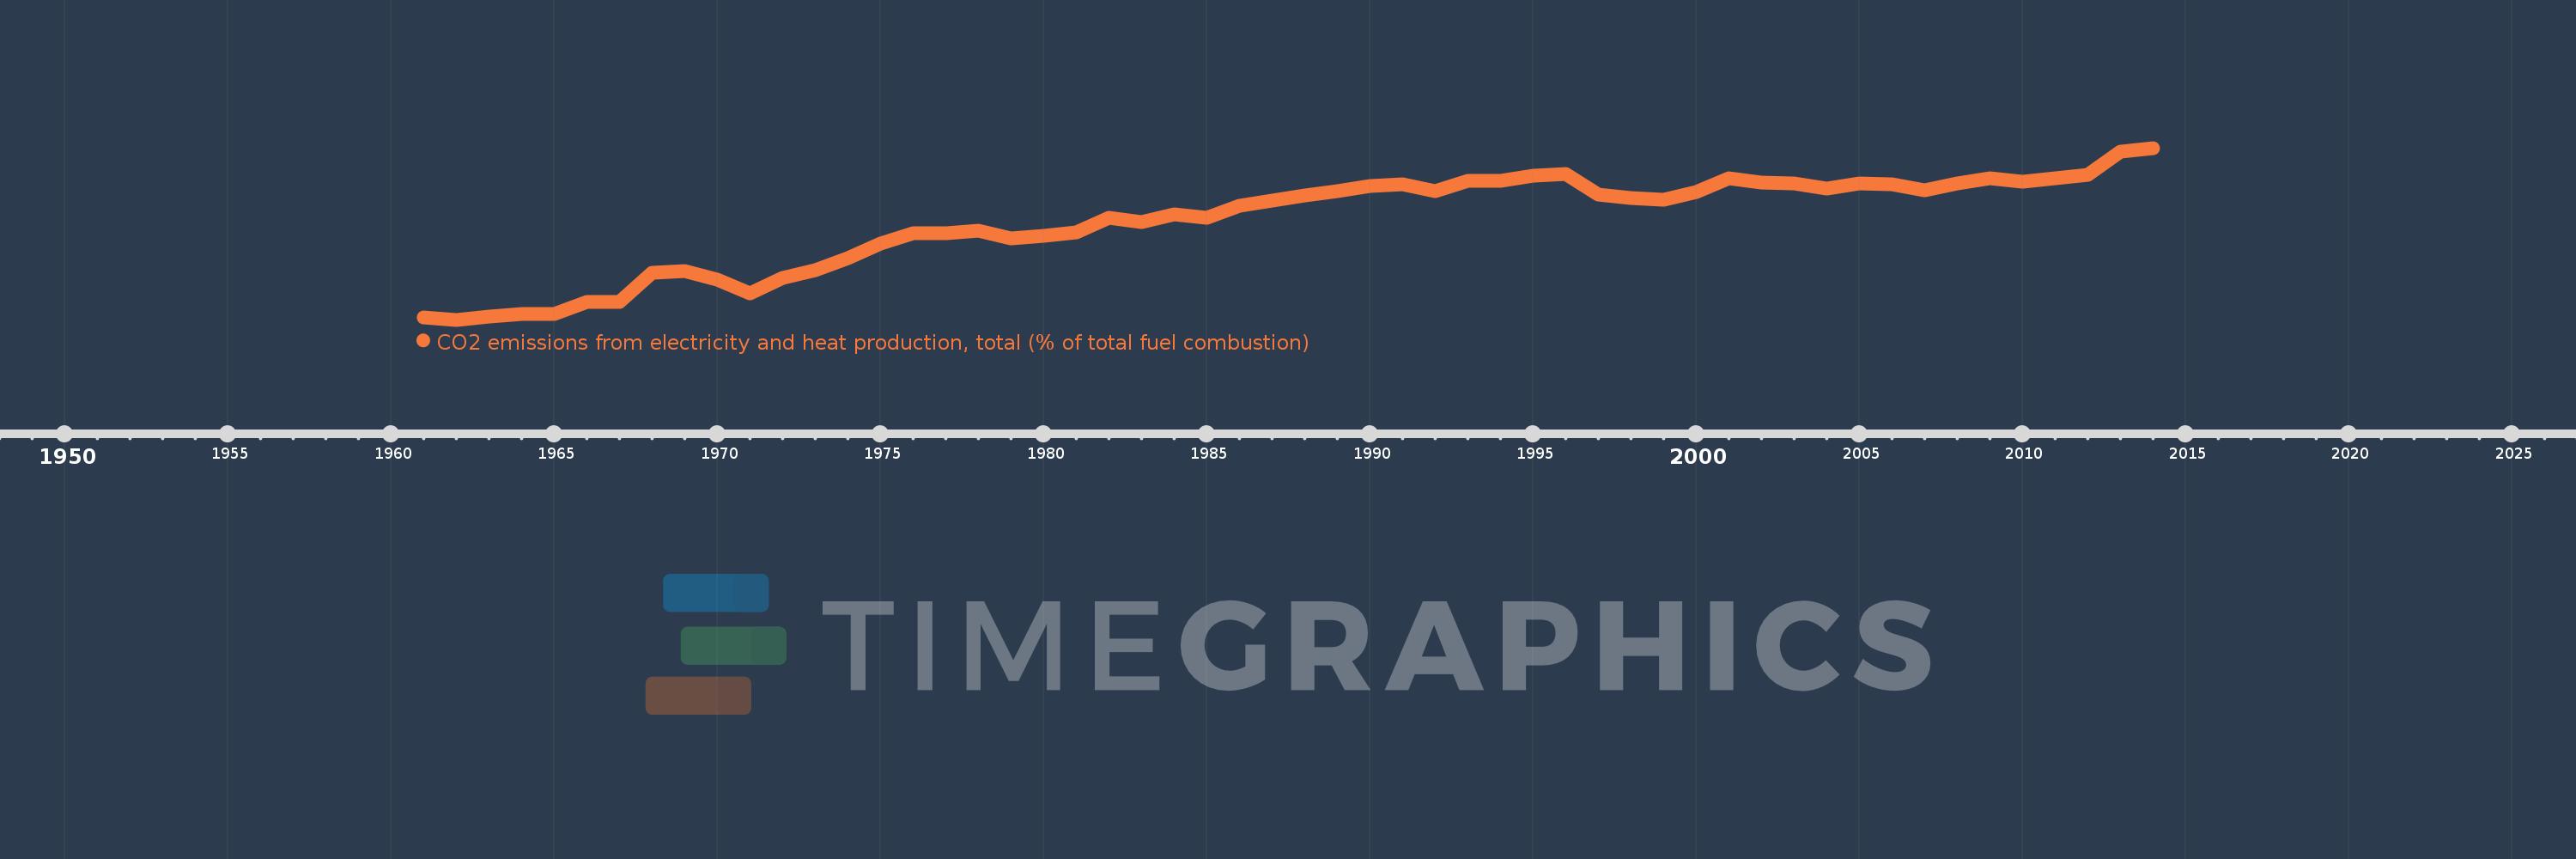
CO2 emissions from electricity and heat production, total (% of total fuel combustion)
2014,2013,2012,2011,2010,2009,2008,2007,2006,2005,2004,2003,2002,2001,2000,1999,1998,1997,1996,1995,1994,1993,1992,1991,1990,1989,1988,1987,1986,1985,1984,1983,1982,1981,1980,1979,1978,1977,1976,1975,1974,1973,1972,1971,1970,1969,1968,1967,1966,1965,1964,1963,1962,1961
Queste statistiche in altri paesi:
AlbaniaAlgeriaAngolaArab WorldArgentinaArmeniaAustraliaAustriaAzerbaijanBahrainBangladeshBelarusBelgiumBeninBoliviaBosnia and HerzegovinaBotswanaBrazilBrunei DarussalamBulgariaCambodiaCameroonCanadaCaribbean small statesCentral Europe and the BalticsChileChinaColombiaCongo, Dem. Rep.Congo, Rep.Costa RicaCote d'IvoireCroatiaCubaCuracaoCyprusCzech RepublicDenmarkDominican RepublicEarly-demographic dividendEast Asia & PacificEast Asia & Pacific (excluding high income)East Asia & Pacific (IDA & IBRD countries)EcuadorEgypt, Arab Rep.El SalvadorEritreaEstoniaEthiopiaEuro areaEurope & Central AsiaEurope & Central Asia (excluding high income)Europe & Central Asia (IDA & IBRD countries)European UnionFinlandFragile and conflict affected situationsFranceGabonGeorgiaGermanyGhanaGibraltarGreeceGuatemalaHaitiHeavily indebted poor countries (HIPC)High incomeHondurasHong Kong SAR, ChinaHungaryIBRD onlyIcelandIDA & IBRD totalIDA blendIDA onlyIDA totalIndiaIndonesiaIran, Islamic Rep.IraqIrelandIsraelItalyJamaicaJapanJordanKazakhstanKenyaKorea, Dem. People’s Rep.Korea, Rep.KosovoKuwaitKyrgyz RepublicLate-demographic dividendLatin America & Caribbean Latin America & Caribbean (excluding high income)Latin America & the Caribbean (IDA & IBRD countries)LatviaLeast developed countries: UN classificationLebanonLibyaLithuaniaLow & middle incomeLow incomeLower middle incomeLuxembourgMacedonia, FYRMalaysiaMaltaMauritiusMexicoMiddle East & North AfricaMiddle East & North Africa (excluding high income)Middle East & North Africa (IDA & IBRD countries)Middle incomeMoldovaMongoliaMontenegroMoroccoMozambiqueMyanmarNamibiaNepalNetherlandsNew ZealandNicaraguaNigerNigeriaNorth AmericaNorwayOECD membersOmanOther small statesPakistanPanamaParaguayPeruPhilippinesPolandPortugalPost-demographic dividendPre-demographic dividendQatarRomaniaRussian FederationSaudi ArabiaSenegalSerbiaSingaporeSlovak RepublicSloveniaSmall statesSouth AfricaSouth AsiaSouth Asia (IDA & IBRD)South SudanSpainSri LankaSub-Saharan Africa Sub-Saharan Africa (excluding high income)Sub-Saharan Africa (IDA & IBRD countries)SudanSwedenSwitzerlandSyrian Arab RepublicTajikistanTanzaniaThailandTogoTrinidad and TobagoTunisiaTurkeyTurkmenistanUkraineUnited Arab EmiratesUnited KingdomUnited StatesUpper middle incomeUruguayUzbekistanVenezuela, RBVietnamWorldYemen, Rep.ZambiaZimbabwe Linea del tempo:
Questa scala temporale mostra un grafico dal 1961 anno al 2014 anno. Greece. I dati fino ad 1960 anno non disponibili. Il numero di osservazioni attuali secondo i date: 54.
La fonte (nome):
Indicatori dello sviluppo mondiale
La fonte (organizzazione):
IEA Statistics © OECD/IEA 2014 (http://www.iea.org/stats/index.asp), subject to https://www.iea.org/t&c/termsandconditions/
Categorie:
Environment
sono stati aggiornati
23 apr 2017 anni
Indicatori delle variazioni dei valori per anni
Minima:
26.474
1 gen 1962 anni
Massimo:
60.328
1 gen 2014 anni
Alla data di osservazione
Valore
Variazione assoluta
La variazione rispetto al valore precedente
1 gen 1961 anni
26.913
+26.913
0.0%
1 gen 1962 anni
26.474
-0.438
-1.63%
1 gen 1963 anni
27.171
+0.697
2.63%
1 gen 1964 anni
27.622
+0.451
1.66%
1 gen 1965 anni
27.568
-0.054
-0.2%
1 gen 1966 anni
29.961
+2.393
8.68%
1 gen 1967 anni
30.007
+0.046
0.15%
1 gen 1968 anni
35.665
+5.658
18.85%
1 gen 1969 anni
36.098
+0.433
1.22%
1 gen 1970 anni
34.357
-1.741
-4.82%
1 gen 1971 anni
31.699
-2.658
-7.74%
1 gen 1972 anni
34.796
+3.097
9.77%
1 gen 1973 anni
36.317
+1.52
4.37%
1 gen 1974 anni
38.671
+2.355
6.48%
1 gen 1975 anni
41.476
+2.804
7.25%
1 gen 1976 anni
43.548
+2.073
5.0%
1 gen 1977 anni
43.523
-0.025
-0.06%
1 gen 1978 anni
43.98
+0.457
1.05%
1 gen 1979 anni
42.569
-1.411
-3.21%
1 gen 1980 anni
42.949
+0.38
0.89%
1 gen 1981 anni
43.771
+0.821
1.91%
1 gen 1982 anni
46.564
+2.793
6.38%
1 gen 1983 anni
45.779
-0.785
-1.69%
1 gen 1984 anni
47.162
+1.383
3.02%
1 gen 1985 anni
46.608
-0.554
-1.17%
1 gen 1986 anni
49.0
+2.393
5.13%
1 gen 1987 anni
49.982
+0.981
2.0%
1 gen 1988 anni
51.011
+1.029
2.06%
1 gen 1989 anni
51.84
+0.829
1.63%
1 gen 1990 anni
52.805
+0.965
1.86%
1 gen 1991 anni
53.133
+0.328
0.62%
1 gen 1992 anni
51.875
-1.258
-2.37%
1 gen 1993 anni
53.773
+1.898
3.66%
1 gen 1994 anni
53.903
+0.13
0.24%
1 gen 1995 anni
54.785
+0.883
1.64%
1 gen 1996 anni
55.142
+0.356
0.65%
1 gen 1997 anni
51.093
-4.049
-7.34%
1 gen 1998 anni
50.465
-0.627
-1.23%
1 gen 1999 anni
50.13
-0.335
-0.66%
1 gen 2000 anni
51.628
+1.498
2.99%
1 gen 2001 anni
54.319
+2.691
5.21%
1 gen 2002 anni
53.541
-0.779
-1.43%
1 gen 2003 anni
53.277
-0.264
-0.49%
1 gen 2004 anni
52.396
-0.88
-1.65%
1 gen 2005 anni
53.421
+1.025
1.96%
1 gen 2006 anni
53.23
-0.191
-0.36%
1 gen 2007 anni
51.949
-1.281
-2.41%
1 gen 2008 anni
53.287
+1.338
2.58%
1 gen 2009 anni
54.322
+1.035
1.94%
1 gen 2010 anni
53.608
-0.714
-1.31%
1 gen 2011 anni
54.304
+0.695
1.3%
1 gen 2012 anni
55.105
+0.802
1.48%
1 gen 2013 anni
59.556
+4.451
8.08%
1 gen 2014 anni
60.328
+0.772
1.3%
Classificazione dei paesi secondo i statistiche attuali per anni


Commenti: