29
/it/
it
AIzaSyAYiBZKx7MnpbEhh9jyipgxe19OcubqV5w
April 1, 2024
124569
Egypt, Arab Rep.
EGY
true
2
1
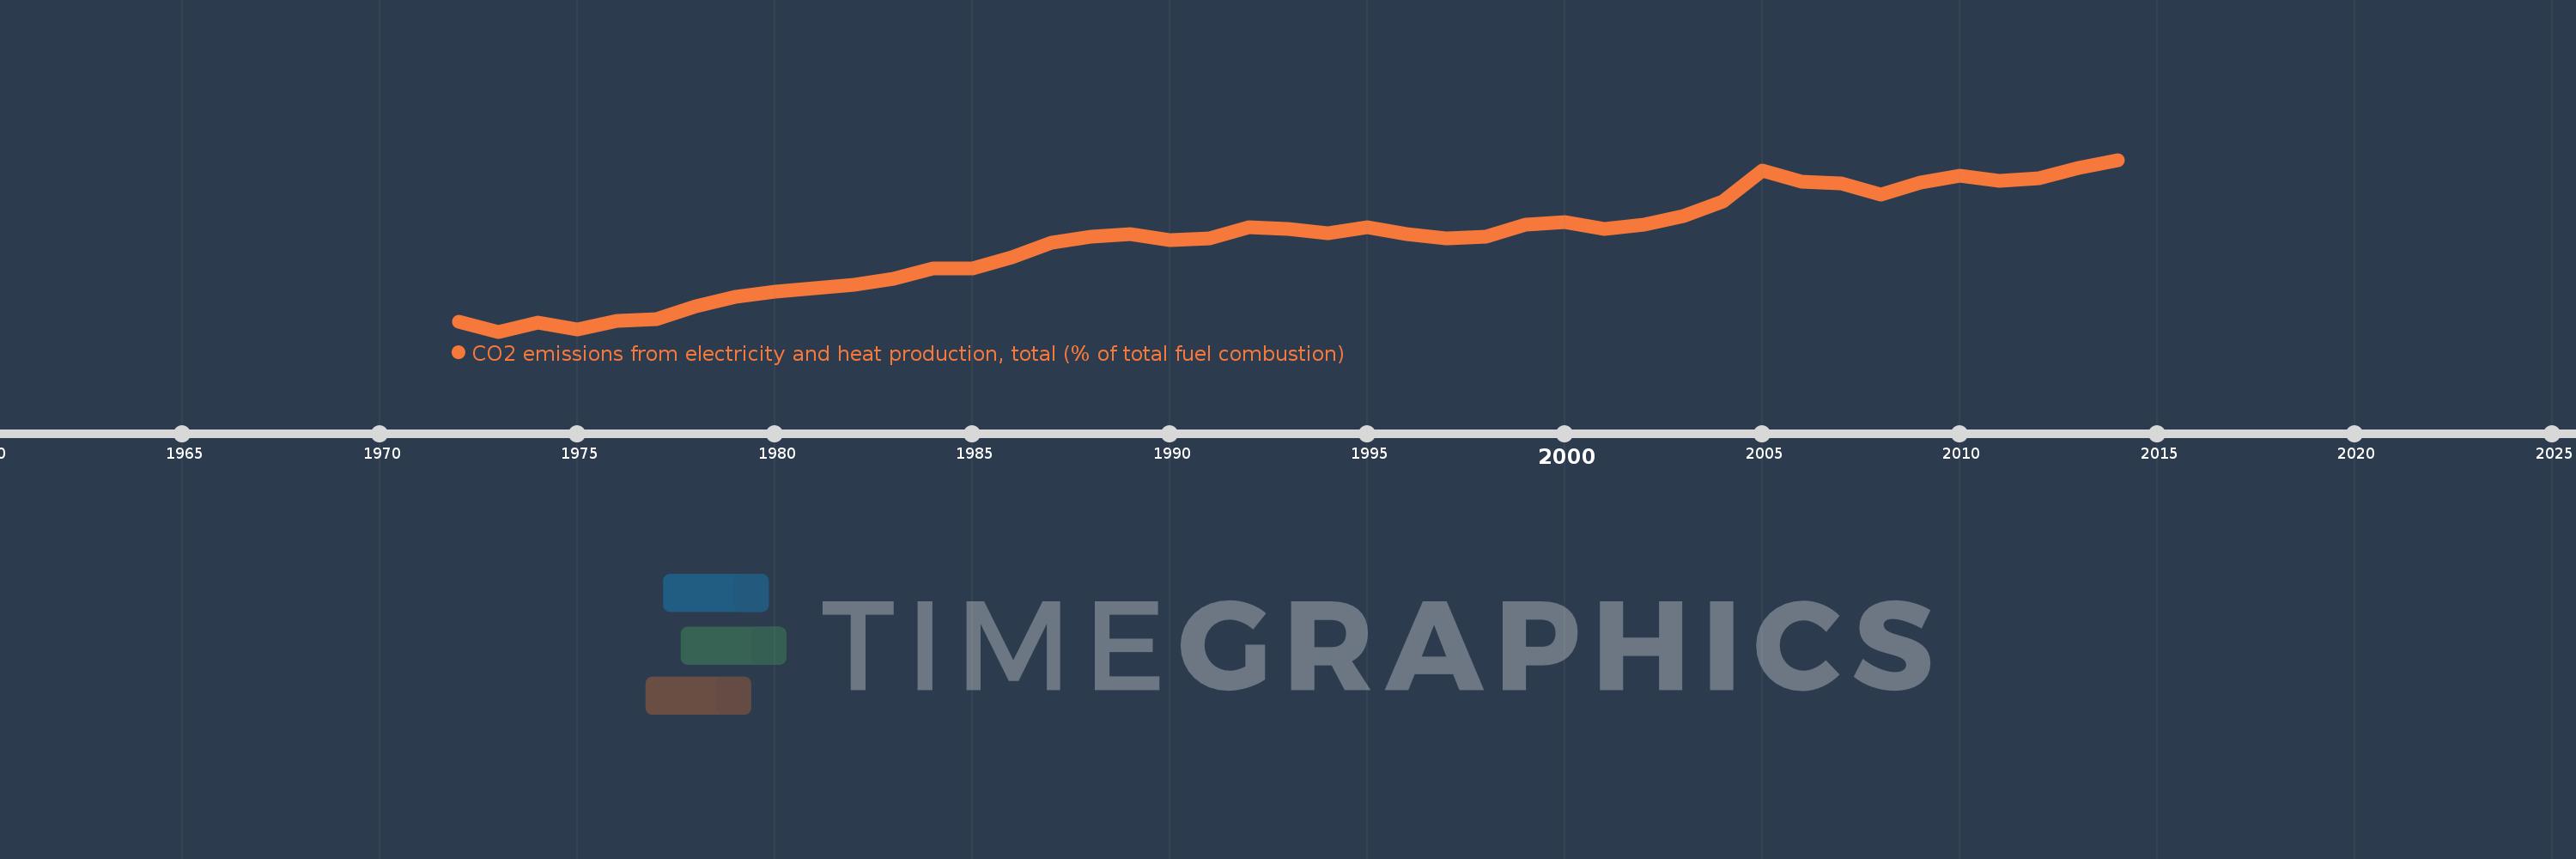
CO2 emissions from electricity and heat production, total (% of total fuel combustion)
2014,2013,2012,2011,2010,2009,2008,2007,2006,2005,2004,2003,2002,2001,2000,1999,1998,1997,1996,1995,1994,1993,1992,1991,1990,1989,1988,1987,1986,1985,1984,1983,1982,1981,1980,1979,1978,1977,1976,1975,1974,1973,1972
Queste statistiche in altri paesi:
AlbaniaAlgeriaAngolaArab WorldArgentinaArmeniaAustraliaAustriaAzerbaijanBahrainBangladeshBelarusBelgiumBeninBoliviaBosnia and HerzegovinaBotswanaBrazilBrunei DarussalamBulgariaCambodiaCameroonCanadaCaribbean small statesCentral Europe and the BalticsChileChinaColombiaCongo, Dem. Rep.Congo, Rep.Costa RicaCote d'IvoireCroatiaCubaCuracaoCyprusCzech RepublicDenmarkDominican RepublicEarly-demographic dividendEast Asia & PacificEast Asia & Pacific (excluding high income)East Asia & Pacific (IDA & IBRD countries)EcuadorEgypt, Arab Rep.El SalvadorEritreaEstoniaEthiopiaEuro areaEurope & Central AsiaEurope & Central Asia (excluding high income)Europe & Central Asia (IDA & IBRD countries)European UnionFinlandFragile and conflict affected situationsFranceGabonGeorgiaGermanyGhanaGibraltarGreeceGuatemalaHaitiHeavily indebted poor countries (HIPC)High incomeHondurasHong Kong SAR, ChinaHungaryIBRD onlyIcelandIDA & IBRD totalIDA blendIDA onlyIDA totalIndiaIndonesiaIran, Islamic Rep.IraqIrelandIsraelItalyJamaicaJapanJordanKazakhstanKenyaKorea, Dem. People’s Rep.Korea, Rep.KosovoKuwaitKyrgyz RepublicLate-demographic dividendLatin America & Caribbean Latin America & Caribbean (excluding high income)Latin America & the Caribbean (IDA & IBRD countries)LatviaLeast developed countries: UN classificationLebanonLibyaLithuaniaLow & middle incomeLow incomeLower middle incomeLuxembourgMacedonia, FYRMalaysiaMaltaMauritiusMexicoMiddle East & North AfricaMiddle East & North Africa (excluding high income)Middle East & North Africa (IDA & IBRD countries)Middle incomeMoldovaMongoliaMontenegroMoroccoMozambiqueMyanmarNamibiaNepalNetherlandsNew ZealandNicaraguaNigerNigeriaNorth AmericaNorwayOECD membersOmanOther small statesPakistanPanamaParaguayPeruPhilippinesPolandPortugalPost-demographic dividendPre-demographic dividendQatarRomaniaRussian FederationSaudi ArabiaSenegalSerbiaSingaporeSlovak RepublicSloveniaSmall statesSouth AfricaSouth AsiaSouth Asia (IDA & IBRD)South SudanSpainSri LankaSub-Saharan Africa Sub-Saharan Africa (excluding high income)Sub-Saharan Africa (IDA & IBRD countries)SudanSwedenSwitzerlandSyrian Arab RepublicTajikistanTanzaniaThailandTogoTrinidad and TobagoTunisiaTurkeyTurkmenistanUkraineUnited Arab EmiratesUnited KingdomUnited StatesUpper middle incomeUruguayUzbekistanVenezuela, RBVietnamWorldYemen, Rep.ZambiaZimbabwe Linea del tempo:
Questa scala temporale mostra un grafico dal 1972 anno al 2014 anno. Egypt, Arab Rep.. I dati fino ad 1971 anno non disponibili. Il numero di osservazioni attuali secondo i date: 43.
La fonte (nome):
Indicatori dello sviluppo mondiale
La fonte (organizzazione):
IEA Statistics © OECD/IEA 2014 (http://www.iea.org/stats/index.asp), subject to https://www.iea.org/t&c/termsandconditions/
Categorie:
Environment
sono stati aggiornati
23 apr 2017 anni
Indicatori delle variazioni dei valori per anni
Minima:
13.981
1 gen 1973 anni
Massimo:
48.275
1 gen 2014 anni
Alla data di osservazione
Valore
Variazione assoluta
La variazione rispetto al valore precedente
1 gen 1972 anni
15.918
+15.918
0.0%
1 gen 1973 anni
13.981
-1.937
-12.17%
1 gen 1974 anni
15.708
+1.727
12.35%
1 gen 1975 anni
14.347
-1.361
-8.67%
1 gen 1976 anni
16.152
+1.805
12.58%
1 gen 1977 anni
16.387
+0.236
1.46%
1 gen 1978 anni
19.1
+2.712
16.55%
1 gen 1979 anni
20.886
+1.787
9.35%
1 gen 1980 anni
21.959
+1.073
5.14%
1 gen 1981 anni
22.711
+0.751
3.42%
1 gen 1982 anni
23.364
+0.654
2.88%
1 gen 1983 anni
24.533
+1.169
5.0%
1 gen 1984 anni
26.612
+2.079
8.47%
1 gen 1985 anni
26.668
+0.056
0.21%
1 gen 1986 anni
28.798
+2.13
7.99%
1 gen 1987 anni
31.658
+2.861
9.93%
1 gen 1988 anni
32.928
+1.27
4.01%
1 gen 1989 anni
33.389
+0.46
1.4%
1 gen 1990 anni
32.247
-1.142
-3.42%
1 gen 1991 anni
32.571
+0.324
1.01%
1 gen 1992 anni
34.831
+2.26
6.94%
1 gen 1993 anni
34.507
-0.324
-0.93%
1 gen 1994 anni
33.537
-0.97
-2.81%
1 gen 1995 anni
34.895
+1.358
4.05%
1 gen 1996 anni
33.509
-1.386
-3.97%
1 gen 1997 anni
32.544
-0.965
-2.88%
1 gen 1998 anni
32.871
+0.327
1.0%
1 gen 1999 anni
35.381
+2.51
7.64%
1 gen 2000 anni
35.848
+0.467
1.32%
1 gen 2001 anni
34.53
-1.318
-3.68%
1 gen 2002 anni
35.378
+0.847
2.45%
1 gen 2003 anni
37.008
+1.631
4.61%
1 gen 2004 anni
39.925
+2.917
7.88%
1 gen 2005 anni
46.097
+6.172
15.46%
1 gen 2006 anni
43.97
-2.127
-4.61%
1 gen 2007 anni
43.581
-0.389
-0.89%
1 gen 2008 anni
41.306
-2.275
-5.22%
1 gen 2009 anni
43.746
+2.44
5.91%
1 gen 2010 anni
45.164
+1.418
3.24%
1 gen 2011 anni
44.127
-1.037
-2.3%
1 gen 2012 anni
44.569
+0.442
1.0%
1 gen 2013 anni
46.585
+2.016
4.52%
1 gen 2014 anni
48.275
+1.69
3.63%
Classificazione dei paesi secondo i statistiche attuali per anni


Commenti: