29
/it/
it
AIzaSyAYiBZKx7MnpbEhh9jyipgxe19OcubqV5w
April 1, 2024
130198
Ethiopia
ETH
true
2
1
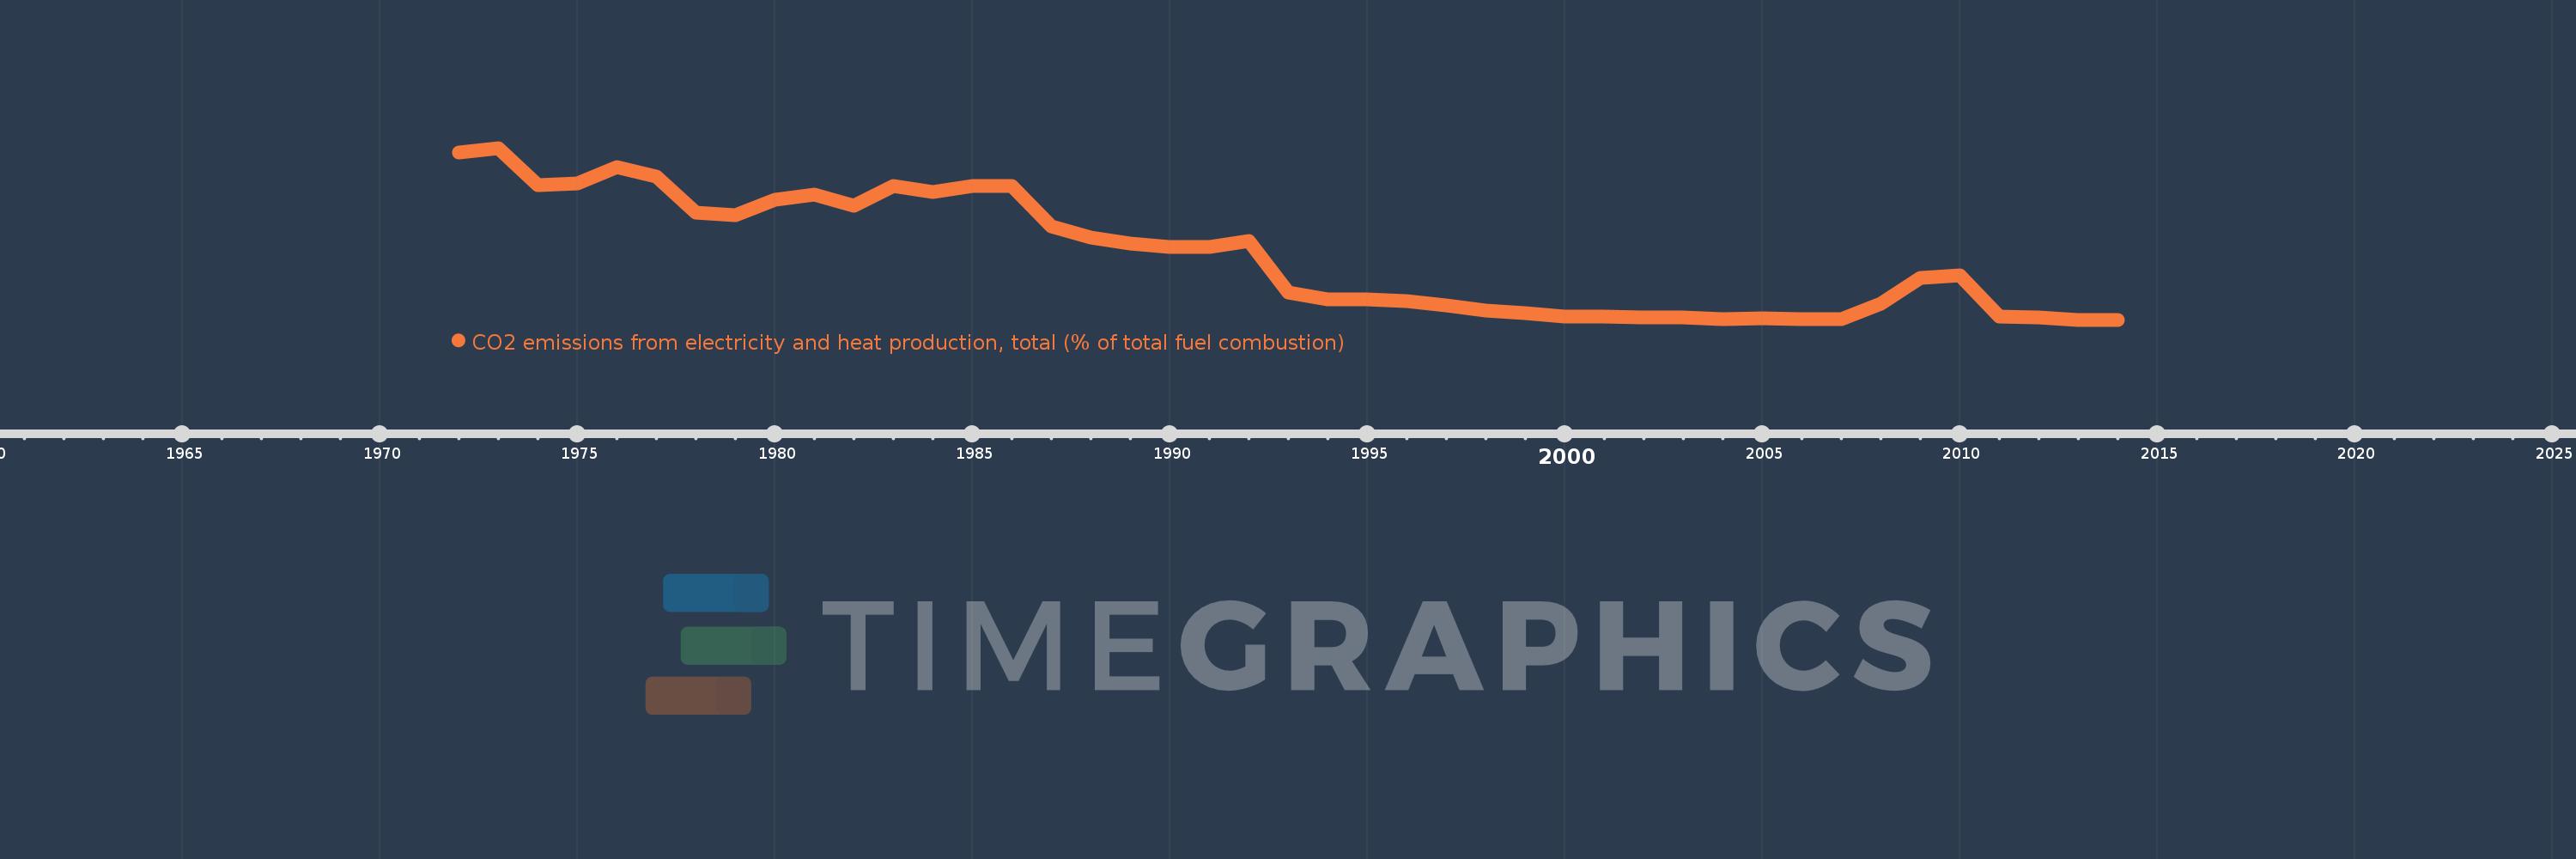
CO2 emissions from electricity and heat production, total (% of total fuel combustion)
2014,2013,2012,2011,2010,2009,2008,2007,2006,2005,2004,2003,2002,2001,2000,1999,1998,1997,1996,1995,1994,1993,1992,1991,1990,1989,1988,1987,1986,1985,1984,1983,1982,1981,1980,1979,1978,1977,1976,1975,1974,1973,1972
Queste statistiche in altri paesi:
AlbaniaAlgeriaAngolaArab WorldArgentinaArmeniaAustraliaAustriaAzerbaijanBahrainBangladeshBelarusBelgiumBeninBoliviaBosnia and HerzegovinaBotswanaBrazilBrunei DarussalamBulgariaCambodiaCameroonCanadaCaribbean small statesCentral Europe and the BalticsChileChinaColombiaCongo, Dem. Rep.Congo, Rep.Costa RicaCote d'IvoireCroatiaCubaCuracaoCyprusCzech RepublicDenmarkDominican RepublicEarly-demographic dividendEast Asia & PacificEast Asia & Pacific (excluding high income)East Asia & Pacific (IDA & IBRD countries)EcuadorEgypt, Arab Rep.El SalvadorEritreaEstoniaEthiopiaEuro areaEurope & Central AsiaEurope & Central Asia (excluding high income)Europe & Central Asia (IDA & IBRD countries)European UnionFinlandFragile and conflict affected situationsFranceGabonGeorgiaGermanyGhanaGibraltarGreeceGuatemalaHaitiHeavily indebted poor countries (HIPC)High incomeHondurasHong Kong SAR, ChinaHungaryIBRD onlyIcelandIDA & IBRD totalIDA blendIDA onlyIDA totalIndiaIndonesiaIran, Islamic Rep.IraqIrelandIsraelItalyJamaicaJapanJordanKazakhstanKenyaKorea, Dem. People’s Rep.Korea, Rep.KosovoKuwaitKyrgyz RepublicLate-demographic dividendLatin America & Caribbean Latin America & Caribbean (excluding high income)Latin America & the Caribbean (IDA & IBRD countries)LatviaLeast developed countries: UN classificationLebanonLibyaLithuaniaLow & middle incomeLow incomeLower middle incomeLuxembourgMacedonia, FYRMalaysiaMaltaMauritiusMexicoMiddle East & North AfricaMiddle East & North Africa (excluding high income)Middle East & North Africa (IDA & IBRD countries)Middle incomeMoldovaMongoliaMontenegroMoroccoMozambiqueMyanmarNamibiaNepalNetherlandsNew ZealandNicaraguaNigerNigeriaNorth AmericaNorwayOECD membersOmanOther small statesPakistanPanamaParaguayPeruPhilippinesPolandPortugalPost-demographic dividendPre-demographic dividendQatarRomaniaRussian FederationSaudi ArabiaSenegalSerbiaSingaporeSlovak RepublicSloveniaSmall statesSouth AfricaSouth AsiaSouth Asia (IDA & IBRD)South SudanSpainSri LankaSub-Saharan Africa Sub-Saharan Africa (excluding high income)Sub-Saharan Africa (IDA & IBRD countries)SudanSwedenSwitzerlandSyrian Arab RepublicTajikistanTanzaniaThailandTogoTrinidad and TobagoTunisiaTurkeyTurkmenistanUkraineUnited Arab EmiratesUnited KingdomUnited StatesUpper middle incomeUruguayUzbekistanVenezuela, RBVietnamWorldYemen, Rep.ZambiaZimbabwe Linea del tempo:
Questa scala temporale mostra un grafico dal 1972 anno al 2014 anno. Ethiopia. I dati fino ad 1971 anno non disponibili. Il numero di osservazioni attuali secondo i date: 43.
La fonte (nome):
Indicatori dello sviluppo mondiale
La fonte (organizzazione):
IEA Statistics © OECD/IEA 2014 (http://www.iea.org/stats/index.asp), subject to https://www.iea.org/t&c/termsandconditions/
Categorie:
Environment
sono stati aggiornati
23 apr 2017 anni
Indicatori delle variazioni dei valori per anni
Minima:
0.118
1 gen 2014 anni
Massimo:
31.405
1 gen 1973 anni
Alla data di osservazione
Valore
Variazione assoluta
La variazione rispetto al valore precedente
1 gen 1972 anni
30.534
+30.534
0.0%
1 gen 1973 anni
31.405
+0.871
2.85%
1 gen 1974 anni
24.615
-6.79
-21.62%
1 gen 1975 anni
25.0
+0.385
1.56%
1 gen 1976 anni
27.966
+2.966
11.86%
1 gen 1977 anni
26.271
-1.695
-6.06%
1 gen 1978 anni
19.658
-6.613
-25.17%
1 gen 1979 anni
19.2
-0.458
-2.33%
1 gen 1980 anni
21.97
+2.77
14.43%
1 gen 1981 anni
22.963
+0.993
4.52%
1 gen 1982 anni
20.805
-2.158
-9.4%
1 gen 1983 anni
24.444
+3.639
17.49%
1 gen 1984 anni
23.448
-0.996
-4.08%
1 gen 1985 anni
24.444
+0.996
4.25%
1 gen 1986 anni
24.46
+0.016
0.07%
1 gen 1987 anni
17.073
-7.387
-30.2%
1 gen 1988 anni
15.054
-2.019
-11.83%
1 gen 1989 anni
13.99
-1.064
-7.07%
1 gen 1990 anni
13.3
-0.689
-4.93%
1 gen 1991 anni
13.364
+0.064
0.48%
1 gen 1992 anni
14.48
+1.116
8.35%
1 gen 1993 anni
5.036
-9.444
-65.22%
1 gen 1994 anni
3.889
-1.147
-22.78%
1 gen 1995 anni
3.865
-0.024
-0.62%
1 gen 1996 anni
3.448
-0.416
-10.78%
1 gen 1997 anni
2.703
-0.746
-21.62%
1 gen 1998 anni
1.818
-0.885
-32.73%
1 gen 1999 anni
1.37
-0.448
-24.66%
1 gen 2000 anni
0.685
-0.685
-50.0%
1 gen 2001 anni
0.625
-0.06
-8.75%
1 gen 2002 anni
0.495
-0.13
-20.79%
1 gen 2003 anni
0.475
-0.02
-4.04%
1 gen 2004 anni
0.219
-0.256
-53.94%
1 gen 2005 anni
0.417
+0.198
90.42%
1 gen 2006 anni
0.223
-0.194
-46.55%
1 gen 2007 anni
0.208
-0.014
-6.46%
1 gen 2008 anni
2.968
+2.76
1.32 Mille.%
1 gen 2009 anni
7.666
+4.698
158.25%
1 gen 2010 anni
8.18
+0.514
6.71%
1 gen 2011 anni
0.671
-7.509
-91.8%
1 gen 2012 anni
0.582
-0.089
-13.25%
1 gen 2013 anni
0.138
-0.445
-76.38%
1 gen 2014 anni
0.118
-0.02
-14.47%
Classificazione dei paesi secondo i statistiche attuali per anni


Commenti: