29
/it/
it
AIzaSyAYiBZKx7MnpbEhh9jyipgxe19OcubqV5w
April 1, 2024
227226
Qatar
QAT
true
2
1
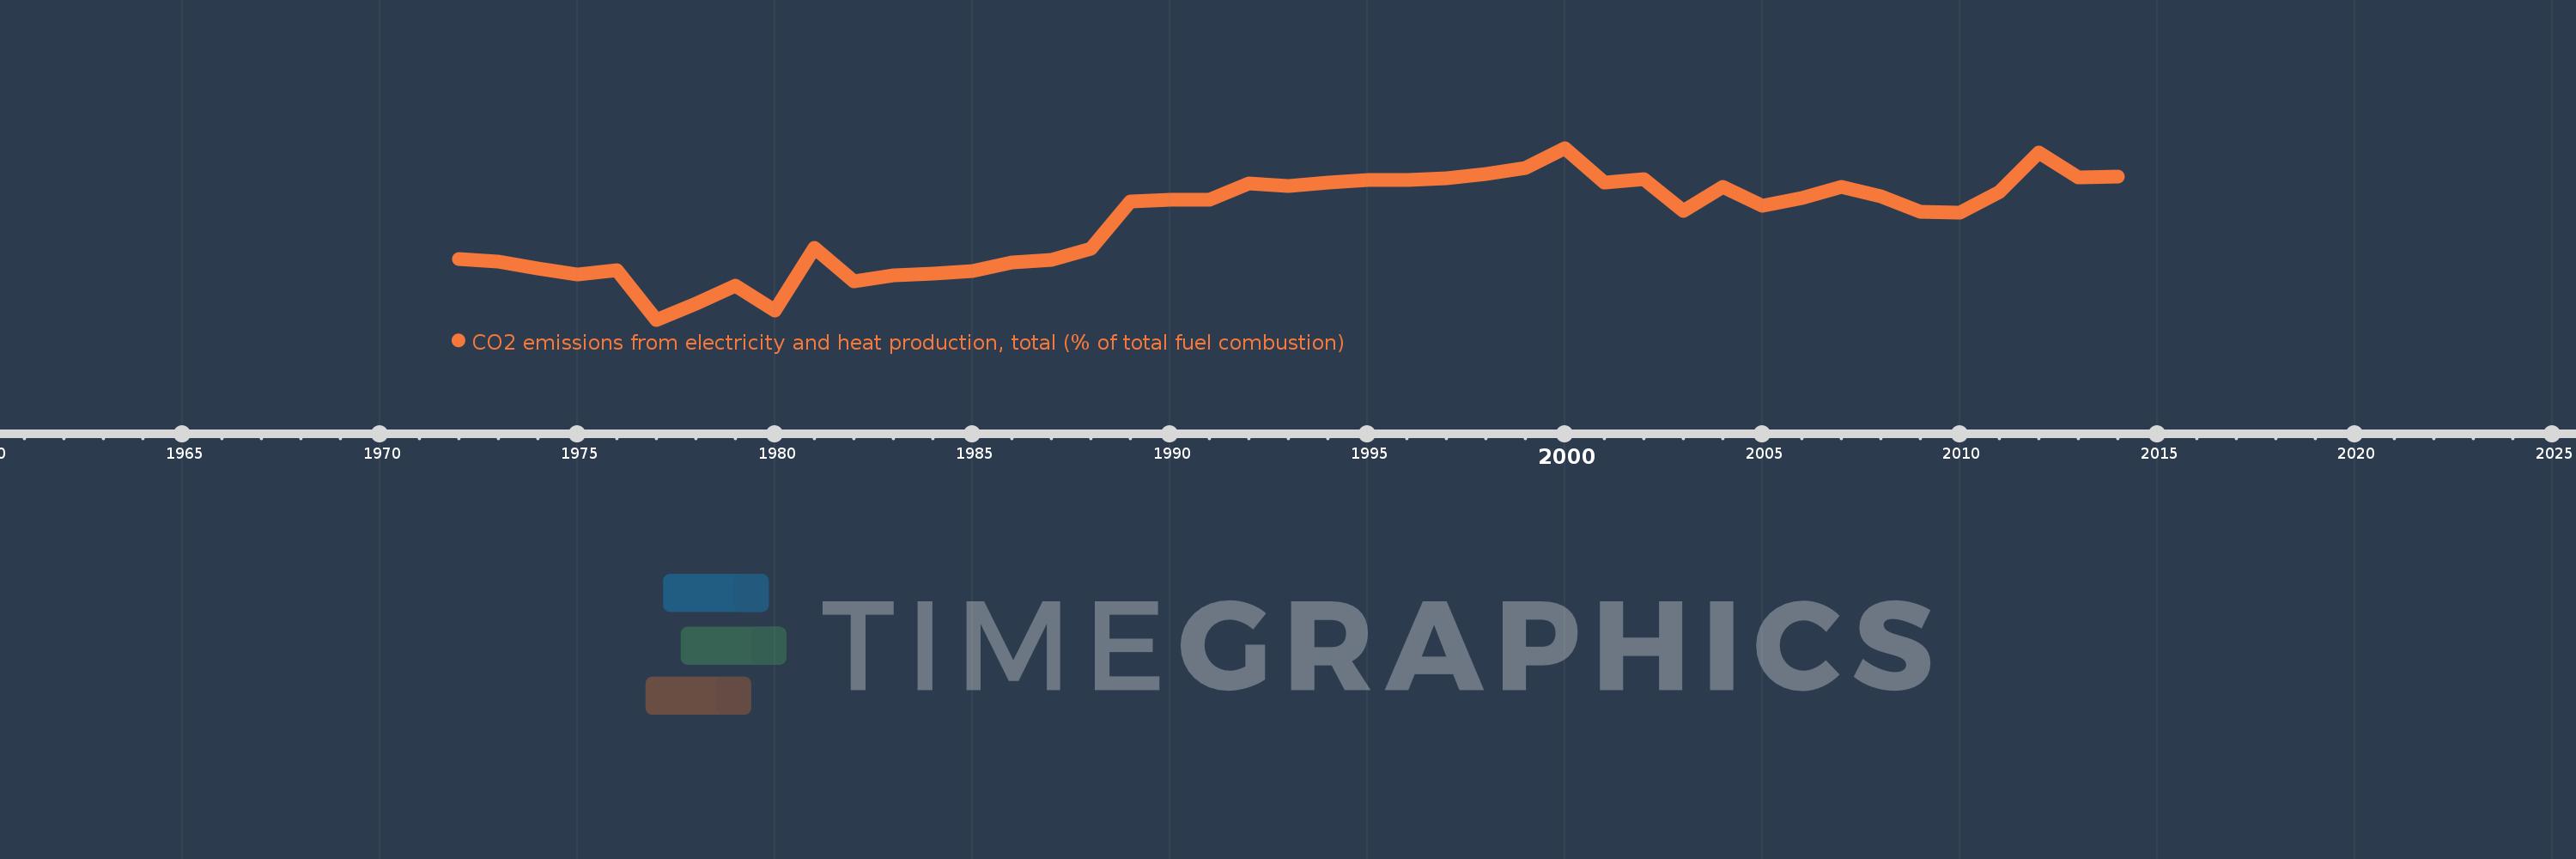
CO2 emissions from electricity and heat production, total (% of total fuel combustion)
2014,2013,2012,2011,2010,2009,2008,2007,2006,2005,2004,2003,2002,2001,2000,1999,1998,1997,1996,1995,1994,1993,1992,1991,1990,1989,1988,1987,1986,1985,1984,1983,1982,1981,1980,1979,1978,1977,1976,1975,1974,1973,1972
Queste statistiche in altri paesi:
AlbaniaAlgeriaAngolaArab WorldArgentinaArmeniaAustraliaAustriaAzerbaijanBahrainBangladeshBelarusBelgiumBeninBoliviaBosnia and HerzegovinaBotswanaBrazilBrunei DarussalamBulgariaCambodiaCameroonCanadaCaribbean small statesCentral Europe and the BalticsChileChinaColombiaCongo, Dem. Rep.Congo, Rep.Costa RicaCote d'IvoireCroatiaCubaCuracaoCyprusCzech RepublicDenmarkDominican RepublicEarly-demographic dividendEast Asia & PacificEast Asia & Pacific (excluding high income)East Asia & Pacific (IDA & IBRD countries)EcuadorEgypt, Arab Rep.El SalvadorEritreaEstoniaEthiopiaEuro areaEurope & Central AsiaEurope & Central Asia (excluding high income)Europe & Central Asia (IDA & IBRD countries)European UnionFinlandFragile and conflict affected situationsFranceGabonGeorgiaGermanyGhanaGibraltarGreeceGuatemalaHaitiHeavily indebted poor countries (HIPC)High incomeHondurasHong Kong SAR, ChinaHungaryIBRD onlyIcelandIDA & IBRD totalIDA blendIDA onlyIDA totalIndiaIndonesiaIran, Islamic Rep.IraqIrelandIsraelItalyJamaicaJapanJordanKazakhstanKenyaKorea, Dem. People’s Rep.Korea, Rep.KosovoKuwaitKyrgyz RepublicLate-demographic dividendLatin America & Caribbean Latin America & Caribbean (excluding high income)Latin America & the Caribbean (IDA & IBRD countries)LatviaLeast developed countries: UN classificationLebanonLibyaLithuaniaLow & middle incomeLow incomeLower middle incomeLuxembourgMacedonia, FYRMalaysiaMaltaMauritiusMexicoMiddle East & North AfricaMiddle East & North Africa (excluding high income)Middle East & North Africa (IDA & IBRD countries)Middle incomeMoldovaMongoliaMontenegroMoroccoMozambiqueMyanmarNamibiaNepalNetherlandsNew ZealandNicaraguaNigerNigeriaNorth AmericaNorwayOECD membersOmanOther small statesPakistanPanamaParaguayPeruPhilippinesPolandPortugalPost-demographic dividendPre-demographic dividendQatarRomaniaRussian FederationSaudi ArabiaSenegalSerbiaSingaporeSlovak RepublicSloveniaSmall statesSouth AfricaSouth AsiaSouth Asia (IDA & IBRD)South SudanSpainSri LankaSub-Saharan Africa Sub-Saharan Africa (excluding high income)Sub-Saharan Africa (IDA & IBRD countries)SudanSwedenSwitzerlandSyrian Arab RepublicTajikistanTanzaniaThailandTogoTrinidad and TobagoTunisiaTurkeyTurkmenistanUkraineUnited Arab EmiratesUnited KingdomUnited StatesUpper middle incomeUruguayUzbekistanVenezuela, RBVietnamWorldYemen, Rep.ZambiaZimbabwe Linea del tempo:
Questa scala temporale mostra un grafico dal 1972 anno al 2014 anno. Qatar. I dati fino ad 1971 anno non disponibili. Il numero di osservazioni attuali secondo i date: 43.
La fonte (nome):
Indicatori dello sviluppo mondiale
La fonte (organizzazione):
IEA Statistics © OECD/IEA 2014 (http://www.iea.org/stats/index.asp), subject to https://www.iea.org/t&c/termsandconditions/
Categorie:
Environment
sono stati aggiornati
23 apr 2017 anni
Indicatori delle variazioni dei valori per anni
Minima:
41.954
1 gen 1977 anni
Massimo:
70.998
1 gen 2000 anni
Alla data di osservazione
Valore
Variazione assoluta
La variazione rispetto al valore precedente
1 gen 1972 anni
52.232
+52.232
0.0%
1 gen 1973 anni
51.822
-0.41
-0.79%
1 gen 1974 anni
50.578
-1.244
-2.4%
1 gen 1975 anni
49.667
-0.911
-1.8%
1 gen 1976 anni
50.304
+0.638
1.28%
1 gen 1977 anni
41.954
-8.35
-16.6%
1 gen 1978 anni
44.691
+2.737
6.52%
1 gen 1979 anni
47.781
+3.089
6.91%
1 gen 1980 anni
43.478
-4.302
-9.0%
1 gen 1981 anni
54.155
+10.676
24.56%
1 gen 1982 anni
48.467
-5.688
-10.5%
1 gen 1983 anni
49.511
+1.044
2.15%
1 gen 1984 anni
49.791
+0.279
0.56%
1 gen 1985 anni
50.141
+0.35
0.7%
1 gen 1986 anni
51.685
+1.545
3.08%
1 gen 1987 anni
52.063
+0.378
0.73%
1 gen 1988 anni
53.912
+1.849
3.55%
1 gen 1989 anni
61.96
+8.048
14.93%
1 gen 1990 anni
62.198
+0.238
0.38%
1 gen 1991 anni
62.188
-0.01
-0.02%
1 gen 1992 anni
65.04
+2.852
4.59%
1 gen 1993 anni
64.637
-0.403
-0.62%
1 gen 1994 anni
65.16
+0.524
0.81%
1 gen 1995 anni
65.545
+0.385
0.59%
1 gen 1996 anni
65.597
+0.052
0.08%
1 gen 1997 anni
65.854
+0.257
0.39%
1 gen 1998 anni
66.667
+0.813
1.23%
1 gen 1999 anni
67.579
+0.913
1.37%
1 gen 2000 anni
70.998
+3.418
5.06%
1 gen 2001 anni
65.082
-5.915
-8.33%
1 gen 2002 anni
65.732
+0.65
1.0%
1 gen 2003 anni
60.301
-5.431
-8.26%
1 gen 2004 anni
64.381
+4.079
6.76%
1 gen 2005 anni
61.18
-3.201
-4.97%
1 gen 2006 anni
62.56
+1.381
2.26%
1 gen 2007 anni
64.447
+1.887
3.02%
1 gen 2008 anni
62.856
-1.592
-2.47%
1 gen 2009 anni
60.262
-2.594
-4.13%
1 gen 2010 anni
60.036
-0.226
-0.38%
1 gen 2011 anni
63.52
+3.484
5.8%
1 gen 2012 anni
70.169
+6.649
10.47%
1 gen 2013 anni
66.06
-4.109
-5.86%
1 gen 2014 anni
66.229
+0.169
0.26%
Classificazione dei paesi secondo i statistiche attuali per anni


Commenti: