29
/it/
it
AIzaSyAYiBZKx7MnpbEhh9jyipgxe19OcubqV5w
April 1, 2024
42168
Latin America & Caribbean (excluding high income)
LAC
false
2
1
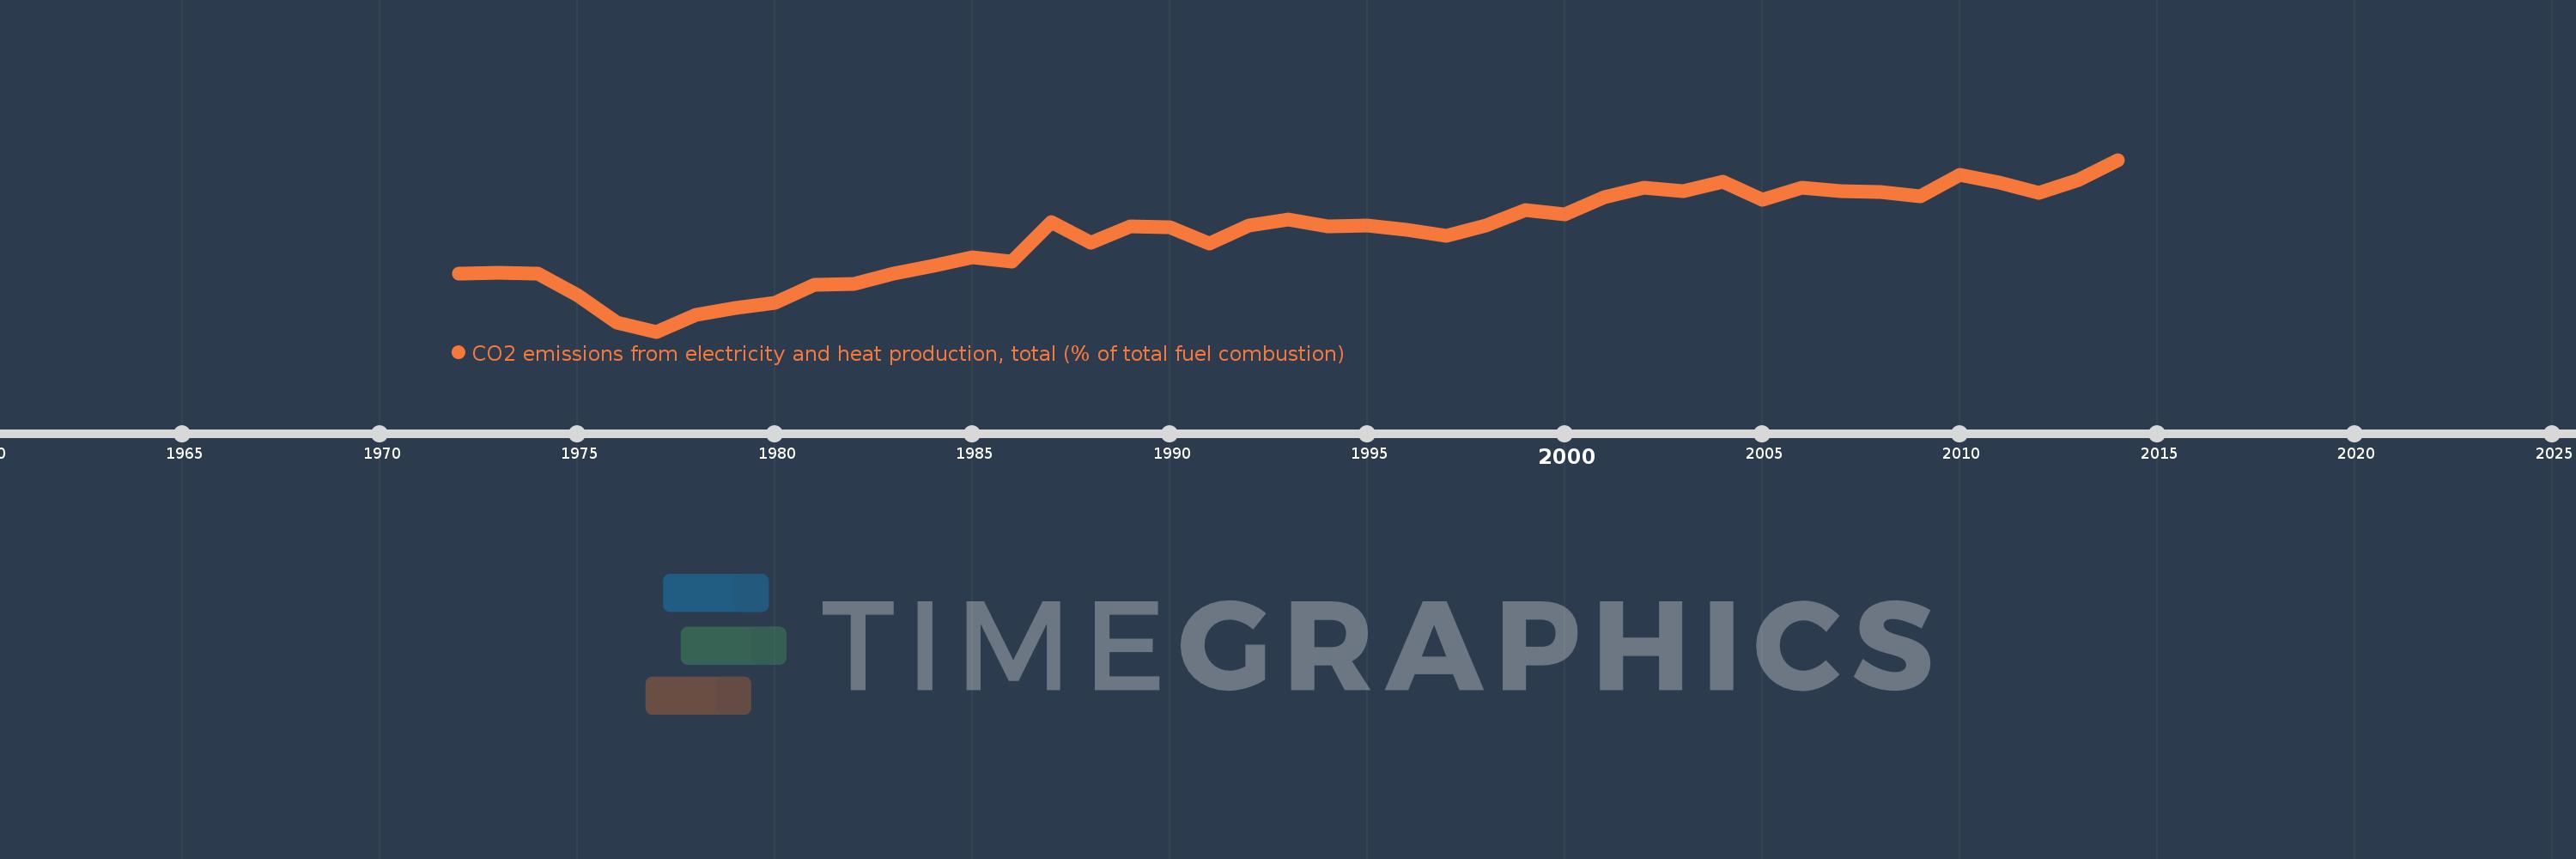
CO2 emissions from electricity and heat production, total (% of total fuel combustion)
2014,2013,2012,2011,2010,2009,2008,2007,2006,2005,2004,2003,2002,2001,2000,1999,1998,1997,1996,1995,1994,1993,1992,1991,1990,1989,1988,1987,1986,1985,1984,1983,1982,1981,1980,1979,1978,1977,1976,1975,1974,1973,1972
Queste statistiche in altri paesi:
AlbaniaAlgeriaAngolaArab WorldArgentinaArmeniaAustraliaAustriaAzerbaijanBahrainBangladeshBelarusBelgiumBeninBoliviaBosnia and HerzegovinaBotswanaBrazilBrunei DarussalamBulgariaCambodiaCameroonCanadaCaribbean small statesCentral Europe and the BalticsChileChinaColombiaCongo, Dem. Rep.Congo, Rep.Costa RicaCote d'IvoireCroatiaCubaCuracaoCyprusCzech RepublicDenmarkDominican RepublicEarly-demographic dividendEast Asia & PacificEast Asia & Pacific (excluding high income)East Asia & Pacific (IDA & IBRD countries)EcuadorEgypt, Arab Rep.El SalvadorEritreaEstoniaEthiopiaEuro areaEurope & Central AsiaEurope & Central Asia (excluding high income)Europe & Central Asia (IDA & IBRD countries)European UnionFinlandFragile and conflict affected situationsFranceGabonGeorgiaGermanyGhanaGibraltarGreeceGuatemalaHaitiHeavily indebted poor countries (HIPC)High incomeHondurasHong Kong SAR, ChinaHungaryIBRD onlyIcelandIDA & IBRD totalIDA blendIDA onlyIDA totalIndiaIndonesiaIran, Islamic Rep.IraqIrelandIsraelItalyJamaicaJapanJordanKazakhstanKenyaKorea, Dem. People’s Rep.Korea, Rep.KosovoKuwaitKyrgyz RepublicLate-demographic dividendLatin America & Caribbean Latin America & Caribbean (excluding high income)Latin America & the Caribbean (IDA & IBRD countries)LatviaLeast developed countries: UN classificationLebanonLibyaLithuaniaLow & middle incomeLow incomeLower middle incomeLuxembourgMacedonia, FYRMalaysiaMaltaMauritiusMexicoMiddle East & North AfricaMiddle East & North Africa (excluding high income)Middle East & North Africa (IDA & IBRD countries)Middle incomeMoldovaMongoliaMontenegroMoroccoMozambiqueMyanmarNamibiaNepalNetherlandsNew ZealandNicaraguaNigerNigeriaNorth AmericaNorwayOECD membersOmanOther small statesPakistanPanamaParaguayPeruPhilippinesPolandPortugalPost-demographic dividendPre-demographic dividendQatarRomaniaRussian FederationSaudi ArabiaSenegalSerbiaSingaporeSlovak RepublicSloveniaSmall statesSouth AfricaSouth AsiaSouth Asia (IDA & IBRD)South SudanSpainSri LankaSub-Saharan Africa Sub-Saharan Africa (excluding high income)Sub-Saharan Africa (IDA & IBRD countries)SudanSwedenSwitzerlandSyrian Arab RepublicTajikistanTanzaniaThailandTogoTrinidad and TobagoTunisiaTurkeyTurkmenistanUkraineUnited Arab EmiratesUnited KingdomUnited StatesUpper middle incomeUruguayUzbekistanVenezuela, RBVietnamWorldYemen, Rep.ZambiaZimbabwe Linea del tempo:
Questa scala temporale mostra un grafico dal 1972 anno al 2014 anno. Latin America & Caribbean (excluding high income). I dati fino ad 1971 anno non disponibili. Il numero di osservazioni attuali secondo i date: 43.
La fonte (nome):
Indicatori dello sviluppo mondiale
La fonte (organizzazione):
IEA Statistics © OECD/IEA 2014 (http://www.iea.org/stats/index.asp), subject to https://www.iea.org/t&c/termsandconditions/
Categorie:
Environment
sono stati aggiornati
23 apr 2017 anni
Indicatori delle variazioni dei valori per anni
Minima:
23.919
1 gen 1977 anni
Massimo:
34.655
1 gen 2014 anni
Alla data di osservazione
Valore
Variazione assoluta
La variazione rispetto al valore precedente
1 gen 1972 anni
27.542
+27.542
0.0%
1 gen 1973 anni
27.621
+0.08
0.29%
1 gen 1974 anni
27.557
-0.064
-0.23%
1 gen 1975 anni
26.209
-1.349
-4.89%
1 gen 1976 anni
24.5
-1.708
-6.52%
1 gen 1977 anni
23.919
-0.581
-2.37%
1 gen 1978 anni
24.992
+1.073
4.49%
1 gen 1979 anni
25.393
+0.401
1.6%
1 gen 1980 anni
25.71
+0.318
1.25%
1 gen 1981 anni
26.865
+1.154
4.49%
1 gen 1982 anni
26.898
+0.034
0.13%
1 gen 1983 anni
27.52
+0.622
2.31%
1 gen 1984 anni
28.025
+0.505
1.83%
1 gen 1985 anni
28.555
+0.53
1.89%
1 gen 1986 anni
28.273
-0.282
-0.99%
1 gen 1987 anni
30.749
+2.476
8.76%
1 gen 1988 anni
29.482
-1.267
-4.12%
1 gen 1989 anni
30.507
+1.026
3.48%
1 gen 1990 anni
30.452
-0.055
-0.18%
1 gen 1991 anni
29.429
-1.023
-3.36%
1 gen 1992 anni
30.536
+1.107
3.76%
1 gen 1993 anni
30.949
+0.413
1.35%
1 gen 1994 anni
30.495
-0.454
-1.47%
1 gen 1995 anni
30.55
+0.054
0.18%
1 gen 1996 anni
30.289
-0.26
-0.85%
1 gen 1997 anni
29.917
-0.373
-1.23%
1 gen 1998 anni
30.56
+0.644
2.15%
1 gen 1999 anni
31.493
+0.933
3.05%
1 gen 2000 anni
31.263
-0.23
-0.73%
1 gen 2001 anni
32.331
+1.067
3.41%
1 gen 2002 anni
32.926
+0.595
1.84%
1 gen 2003 anni
32.683
-0.243
-0.74%
1 gen 2004 anni
33.303
+0.62
1.9%
1 gen 2005 anni
32.153
-1.149
-3.45%
1 gen 2006 anni
32.889
+0.736
2.29%
1 gen 2007 anni
32.672
-0.217
-0.66%
1 gen 2008 anni
32.654
-0.019
-0.06%
1 gen 2009 anni
32.356
-0.297
-0.91%
1 gen 2010 anni
33.71
+1.354
4.18%
1 gen 2011 anni
33.254
-0.456
-1.35%
1 gen 2012 anni
32.567
-0.687
-2.06%
1 gen 2013 anni
33.385
+0.818
2.51%
1 gen 2014 anni
34.655
+1.27
3.8%
Classificazione dei paesi secondo i statistiche attuali per anni


Commenti: