29
/it/
it
AIzaSyAYiBZKx7MnpbEhh9jyipgxe19OcubqV5w
April 1, 2024
140111
Ghana
GHA
true
2
1
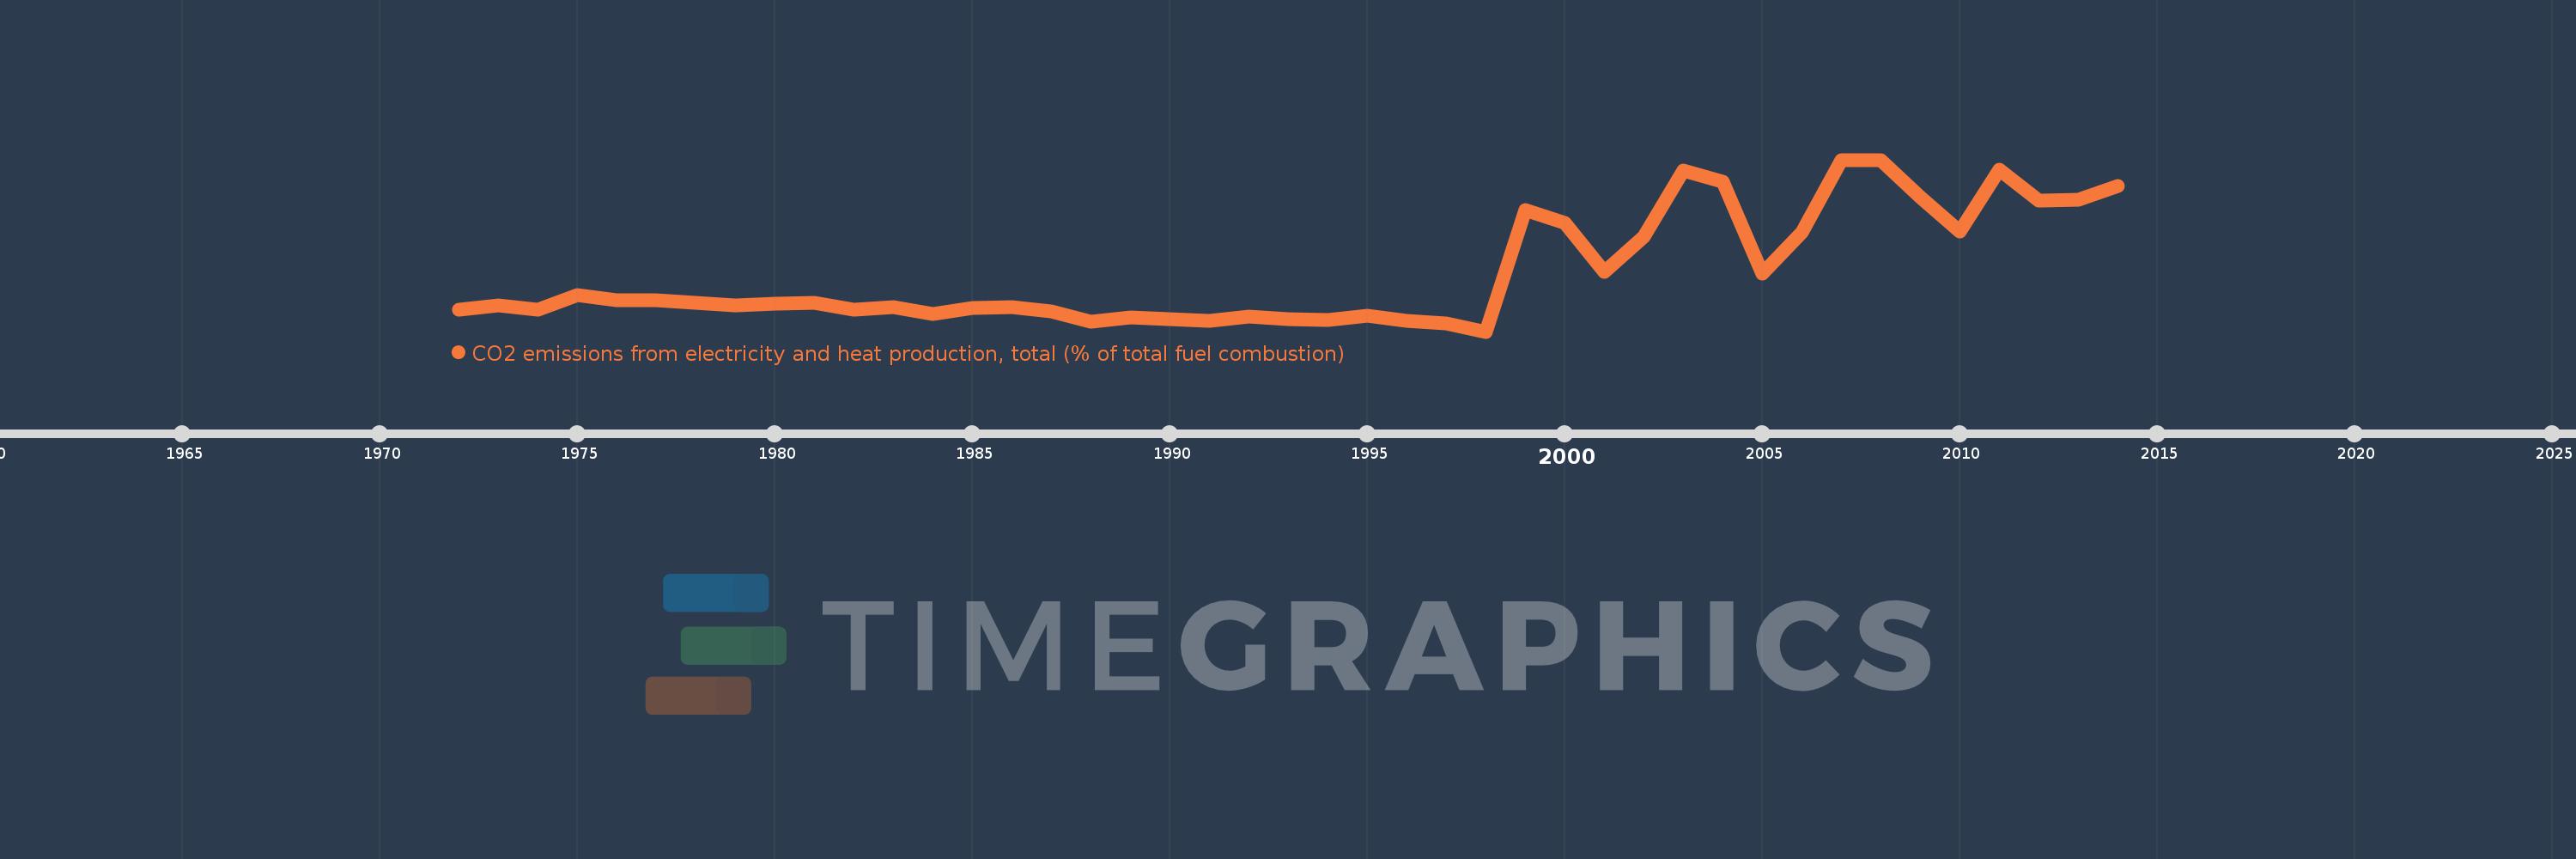
CO2 emissions from electricity and heat production, total (% of total fuel combustion)
2014,2013,2012,2011,2010,2009,2008,2007,2006,2005,2004,2003,2002,2001,2000,1999,1998,1997,1996,1995,1994,1993,1992,1991,1990,1989,1988,1987,1986,1985,1984,1983,1982,1981,1980,1979,1978,1977,1976,1975,1974,1973,1972
Queste statistiche in altri paesi:
AlbaniaAlgeriaAngolaArab WorldArgentinaArmeniaAustraliaAustriaAzerbaijanBahrainBangladeshBelarusBelgiumBeninBoliviaBosnia and HerzegovinaBotswanaBrazilBrunei DarussalamBulgariaCambodiaCameroonCanadaCaribbean small statesCentral Europe and the BalticsChileChinaColombiaCongo, Dem. Rep.Congo, Rep.Costa RicaCote d'IvoireCroatiaCubaCuracaoCyprusCzech RepublicDenmarkDominican RepublicEarly-demographic dividendEast Asia & PacificEast Asia & Pacific (excluding high income)East Asia & Pacific (IDA & IBRD countries)EcuadorEgypt, Arab Rep.El SalvadorEritreaEstoniaEthiopiaEuro areaEurope & Central AsiaEurope & Central Asia (excluding high income)Europe & Central Asia (IDA & IBRD countries)European UnionFinlandFragile and conflict affected situationsFranceGabonGeorgiaGermanyGhanaGibraltarGreeceGuatemalaHaitiHeavily indebted poor countries (HIPC)High incomeHondurasHong Kong SAR, ChinaHungaryIBRD onlyIcelandIDA & IBRD totalIDA blendIDA onlyIDA totalIndiaIndonesiaIran, Islamic Rep.IraqIrelandIsraelItalyJamaicaJapanJordanKazakhstanKenyaKorea, Dem. People’s Rep.Korea, Rep.KosovoKuwaitKyrgyz RepublicLate-demographic dividendLatin America & Caribbean Latin America & Caribbean (excluding high income)Latin America & the Caribbean (IDA & IBRD countries)LatviaLeast developed countries: UN classificationLebanonLibyaLithuaniaLow & middle incomeLow incomeLower middle incomeLuxembourgMacedonia, FYRMalaysiaMaltaMauritiusMexicoMiddle East & North AfricaMiddle East & North Africa (excluding high income)Middle East & North Africa (IDA & IBRD countries)Middle incomeMoldovaMongoliaMontenegroMoroccoMozambiqueMyanmarNamibiaNepalNetherlandsNew ZealandNicaraguaNigerNigeriaNorth AmericaNorwayOECD membersOmanOther small statesPakistanPanamaParaguayPeruPhilippinesPolandPortugalPost-demographic dividendPre-demographic dividendQatarRomaniaRussian FederationSaudi ArabiaSenegalSerbiaSingaporeSlovak RepublicSloveniaSmall statesSouth AfricaSouth AsiaSouth Asia (IDA & IBRD)South SudanSpainSri LankaSub-Saharan Africa Sub-Saharan Africa (excluding high income)Sub-Saharan Africa (IDA & IBRD countries)SudanSwedenSwitzerlandSyrian Arab RepublicTajikistanTanzaniaThailandTogoTrinidad and TobagoTunisiaTurkeyTurkmenistanUkraineUnited Arab EmiratesUnited KingdomUnited StatesUpper middle incomeUruguayUzbekistanVenezuela, RBVietnamWorldYemen, Rep.ZambiaZimbabwe Linea del tempo:
Questa scala temporale mostra un grafico dal 1972 anno al 2014 anno. Ghana. I dati fino ad 1971 anno non disponibili. Il numero di osservazioni attuali secondo i date: 43.
La fonte (nome):
Indicatori dello sviluppo mondiale
La fonte (organizzazione):
IEA Statistics © OECD/IEA 2014 (http://www.iea.org/stats/index.asp), subject to https://www.iea.org/t&c/termsandconditions/
Categorie:
Environment
sono stati aggiornati
23 apr 2017 anni
Indicatori delle variazioni dei valori per anni
Minima:
0.833
1 gen 1998 anni
Massimo:
31.466
1 gen 2008 anni
Alla data di osservazione
Valore
Variazione assoluta
La variazione rispetto al valore precedente
1 gen 1972 anni
4.712
+4.712
0.0%
1 gen 1973 anni
5.473
+0.761
16.14%
1 gen 1974 anni
4.808
-0.665
-12.15%
1 gen 1975 anni
7.339
+2.532
52.66%
1 gen 1976 anni
6.494
-0.846
-11.53%
1 gen 1977 anni
6.383
-0.111
-1.7%
1 gen 1978 anni
5.976
-0.407
-6.37%
1 gen 1979 anni
5.534
-0.442
-7.4%
1 gen 1980 anni
5.882
+0.349
6.3%
1 gen 1981 anni
5.936
+0.054
0.91%
1 gen 1982 anni
4.797
-1.139
-19.19%
1 gen 1983 anni
5.195
+0.398
8.29%
1 gen 1984 anni
4.0
-1.195
-23.0%
1 gen 1985 anni
4.972
+0.972
24.31%
1 gen 1986 anni
5.263
+0.291
5.85%
1 gen 1987 anni
4.484
-0.779
-14.8%
1 gen 1988 anni
2.586
-1.898
-42.33%
1 gen 1989 anni
3.347
+0.761
29.43%
1 gen 1990 anni
3.03
-0.317
-9.47%
1 gen 1991 anni
2.756
-0.274
-9.06%
1 gen 1992 anni
3.509
+0.753
27.32%
1 gen 1993 anni
2.985
-0.524
-14.93%
1 gen 1994 anni
2.941
-0.044
-1.47%
1 gen 1995 anni
3.741
+0.8
27.21%
1 gen 1996 anni
2.804
-0.938
-25.06%
1 gen 1997 anni
2.279
-0.525
-18.71%
1 gen 1998 anni
0.833
-1.446
-63.44%
1 gen 1999 anni
22.527
+21.694
2.6 Mille.%
1 gen 2000 anni
20.137
-2.391
-10.61%
1 gen 2001 anni
11.446
-8.691
-43.16%
1 gen 2002 anni
17.701
+6.255
54.65%
1 gen 2003 anni
29.596
+11.896
67.2%
1 gen 2004 anni
27.613
-1.983
-6.7%
1 gen 2005 anni
11.149
-16.464
-59.63%
1 gen 2006 anni
18.594
+7.445
66.78%
1 gen 2007 anni
31.355
+12.761
68.63%
1 gen 2008 anni
31.466
+0.111
0.35%
1 gen 2009 anni
24.742
-6.724
-21.37%
1 gen 2010 anni
18.703
-6.04
-24.41%
1 gen 2011 anni
29.665
+10.962
58.61%
1 gen 2012 anni
24.214
-5.451
-18.37%
1 gen 2013 anni
24.354
+0.14
0.58%
1 gen 2014 anni
26.74
+2.386
9.8%
Classificazione dei paesi secondo i statistiche attuali per anni


Commenti: