29
/it/
it
AIzaSyAYiBZKx7MnpbEhh9jyipgxe19OcubqV5w
April 1, 2024
52463
OECD members
OED
false
2
1
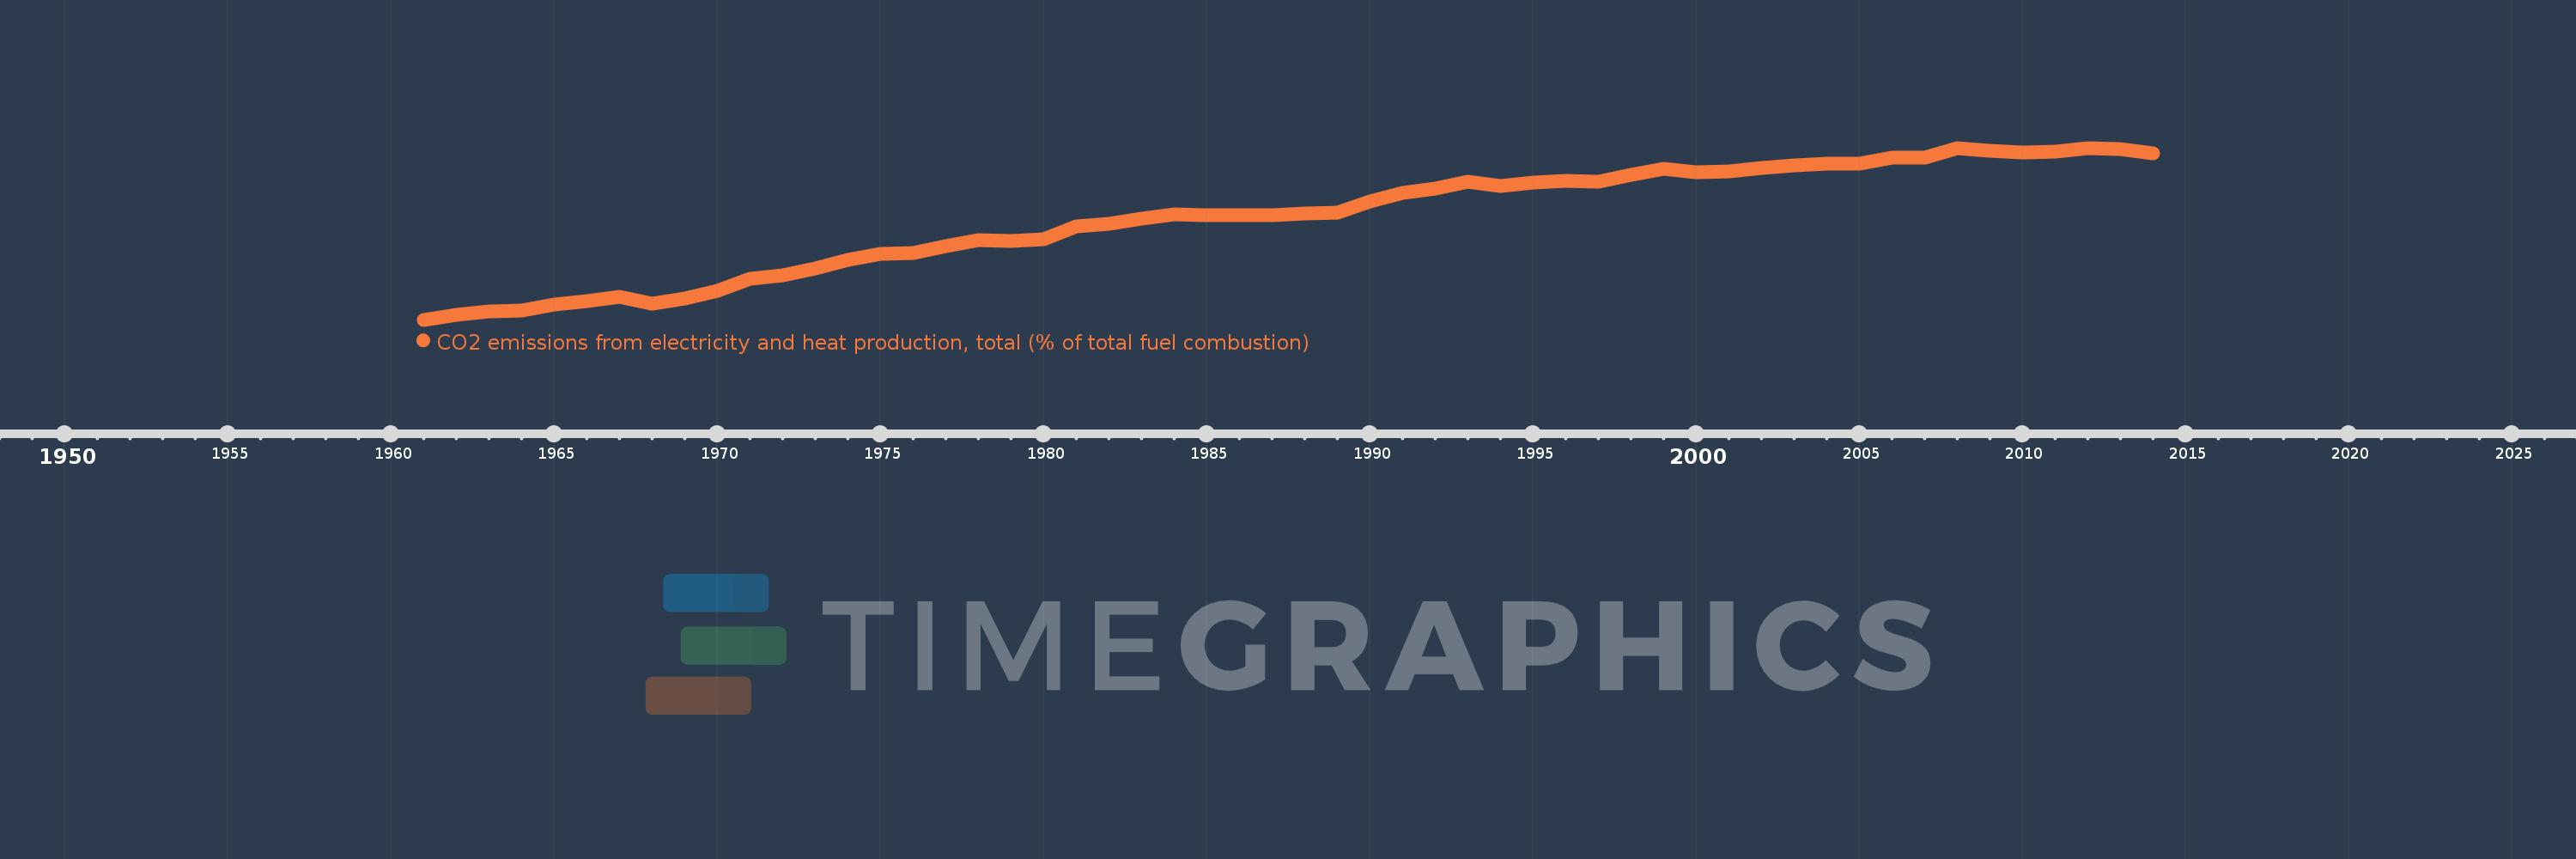
CO2 emissions from electricity and heat production, total (% of total fuel combustion)
2014,2013,2012,2011,2010,2009,2008,2007,2006,2005,2004,2003,2002,2001,2000,1999,1998,1997,1996,1995,1994,1993,1992,1991,1990,1989,1988,1987,1986,1985,1984,1983,1982,1981,1980,1979,1978,1977,1976,1975,1974,1973,1972,1971,1970,1969,1968,1967,1966,1965,1964,1963,1962,1961
Queste statistiche in altri paesi:
AlbaniaAlgeriaAngolaArab WorldArgentinaArmeniaAustraliaAustriaAzerbaijanBahrainBangladeshBelarusBelgiumBeninBoliviaBosnia and HerzegovinaBotswanaBrazilBrunei DarussalamBulgariaCambodiaCameroonCanadaCaribbean small statesCentral Europe and the BalticsChileChinaColombiaCongo, Dem. Rep.Congo, Rep.Costa RicaCote d'IvoireCroatiaCubaCuracaoCyprusCzech RepublicDenmarkDominican RepublicEarly-demographic dividendEast Asia & PacificEast Asia & Pacific (excluding high income)East Asia & Pacific (IDA & IBRD countries)EcuadorEgypt, Arab Rep.El SalvadorEritreaEstoniaEthiopiaEuro areaEurope & Central AsiaEurope & Central Asia (excluding high income)Europe & Central Asia (IDA & IBRD countries)European UnionFinlandFragile and conflict affected situationsFranceGabonGeorgiaGermanyGhanaGibraltarGreeceGuatemalaHaitiHeavily indebted poor countries (HIPC)High incomeHondurasHong Kong SAR, ChinaHungaryIBRD onlyIcelandIDA & IBRD totalIDA blendIDA onlyIDA totalIndiaIndonesiaIran, Islamic Rep.IraqIrelandIsraelItalyJamaicaJapanJordanKazakhstanKenyaKorea, Dem. People’s Rep.Korea, Rep.KosovoKuwaitKyrgyz RepublicLate-demographic dividendLatin America & Caribbean Latin America & Caribbean (excluding high income)Latin America & the Caribbean (IDA & IBRD countries)LatviaLeast developed countries: UN classificationLebanonLibyaLithuaniaLow & middle incomeLow incomeLower middle incomeLuxembourgMacedonia, FYRMalaysiaMaltaMauritiusMexicoMiddle East & North AfricaMiddle East & North Africa (excluding high income)Middle East & North Africa (IDA & IBRD countries)Middle incomeMoldovaMongoliaMontenegroMoroccoMozambiqueMyanmarNamibiaNepalNetherlandsNew ZealandNicaraguaNigerNigeriaNorth AmericaNorwayOECD membersOmanOther small statesPakistanPanamaParaguayPeruPhilippinesPolandPortugalPost-demographic dividendPre-demographic dividendQatarRomaniaRussian FederationSaudi ArabiaSenegalSerbiaSingaporeSlovak RepublicSloveniaSmall statesSouth AfricaSouth AsiaSouth Asia (IDA & IBRD)South SudanSpainSri LankaSub-Saharan Africa Sub-Saharan Africa (excluding high income)Sub-Saharan Africa (IDA & IBRD countries)SudanSwedenSwitzerlandSyrian Arab RepublicTajikistanTanzaniaThailandTogoTrinidad and TobagoTunisiaTurkeyTurkmenistanUkraineUnited Arab EmiratesUnited KingdomUnited StatesUpper middle incomeUruguayUzbekistanVenezuela, RBVietnamWorldYemen, Rep.ZambiaZimbabwe Linea del tempo:
Questa scala temporale mostra un grafico dal 1961 anno al 2014 anno. OECD members. I dati fino ad 1960 anno non disponibili. Il numero di osservazioni attuali secondo i date: 54.
La fonte (nome):
Indicatori dello sviluppo mondiale
La fonte (organizzazione):
IEA Statistics © OECD/IEA 2014 (http://www.iea.org/stats/index.asp), subject to https://www.iea.org/t&c/termsandconditions/
Categorie:
Environment
sono stati aggiornati
23 apr 2017 anni
Indicatori delle variazioni dei valori per anni
Minima:
28.564
1 gen 1961 anni
Massimo:
47.046
1 gen 2012 anni
Alla data di osservazione
Valore
Variazione assoluta
La variazione rispetto al valore precedente
1 gen 1961 anni
28.564
+28.564
0.0%
1 gen 1962 anni
29.128
+0.564
1.98%
1 gen 1963 anni
29.416
+0.287
0.99%
1 gen 1964 anni
29.585
+0.169
0.58%
1 gen 1965 anni
30.206
+0.621
2.1%
1 gen 1966 anni
30.607
+0.401
1.33%
1 gen 1967 anni
31.035
+0.428
1.4%
1 gen 1968 anni
30.3
-0.735
-2.37%
1 gen 1969 anni
30.844
+0.544
1.8%
1 gen 1970 anni
31.723
+0.879
2.85%
1 gen 1971 anni
32.988
+1.265
3.99%
1 gen 1972 anni
33.37
+0.382
1.16%
1 gen 1973 anni
34.045
+0.675
2.02%
1 gen 1974 anni
34.972
+0.927
2.72%
1 gen 1975 anni
35.634
+0.662
1.89%
1 gen 1976 anni
35.755
+0.12
0.34%
1 gen 1977 anni
36.439
+0.684
1.91%
1 gen 1978 anni
37.09
+0.651
1.79%
1 gen 1979 anni
37.059
-0.03
-0.08%
1 gen 1980 anni
37.239
+0.179
0.48%
1 gen 1981 anni
38.572
+1.334
3.58%
1 gen 1982 anni
38.914
+0.342
0.89%
1 gen 1983 anni
39.42
+0.506
1.3%
1 gen 1984 anni
39.943
+0.523
1.33%
1 gen 1985 anni
39.781
-0.162
-0.41%
1 gen 1986 anni
39.829
+0.048
0.12%
1 gen 1987 anni
39.844
+0.015
0.04%
1 gen 1988 anni
40.02
+0.176
0.44%
1 gen 1989 anni
40.073
+0.053
0.13%
1 gen 1990 anni
41.279
+1.206
3.01%
1 gen 1991 anni
42.234
+0.955
2.31%
1 gen 1992 anni
42.657
+0.423
1.0%
1 gen 1993 anni
43.394
+0.737
1.73%
1 gen 1994 anni
42.926
-0.468
-1.08%
1 gen 1995 anni
43.34
+0.414
0.97%
1 gen 1996 anni
43.477
+0.137
0.32%
1 gen 1997 anni
43.431
-0.046
-0.11%
1 gen 1998 anni
44.144
+0.713
1.64%
1 gen 1999 anni
44.757
+0.613
1.39%
1 gen 2000 anni
44.455
-0.301
-0.67%
1 gen 2001 anni
44.565
+0.109
0.25%
1 gen 2002 anni
44.933
+0.369
0.83%
1 gen 2003 anni
45.166
+0.233
0.52%
1 gen 2004 anni
45.348
+0.182
0.4%
1 gen 2005 anni
45.371
+0.023
0.05%
1 gen 2006 anni
46.01
+0.639
1.41%
1 gen 2007 anni
45.993
-0.017
-0.04%
1 gen 2008 anni
47.009
+1.016
2.21%
1 gen 2009 anni
46.779
-0.231
-0.49%
1 gen 2010 anni
46.515
-0.264
-0.56%
1 gen 2011 anni
46.682
+0.167
0.36%
1 gen 2012 anni
47.046
+0.364
0.78%
1 gen 2013 anni
46.935
-0.111
-0.24%
1 gen 2014 anni
46.419
-0.516
-1.1%
Classificazione dei paesi secondo i statistiche attuali per anni


Commenti: