29
/pt/
pt
AIzaSyAYiBZKx7MnpbEhh9jyipgxe19OcubqV5w
April 1, 2024
141606
Greece
GRC
true
2
1
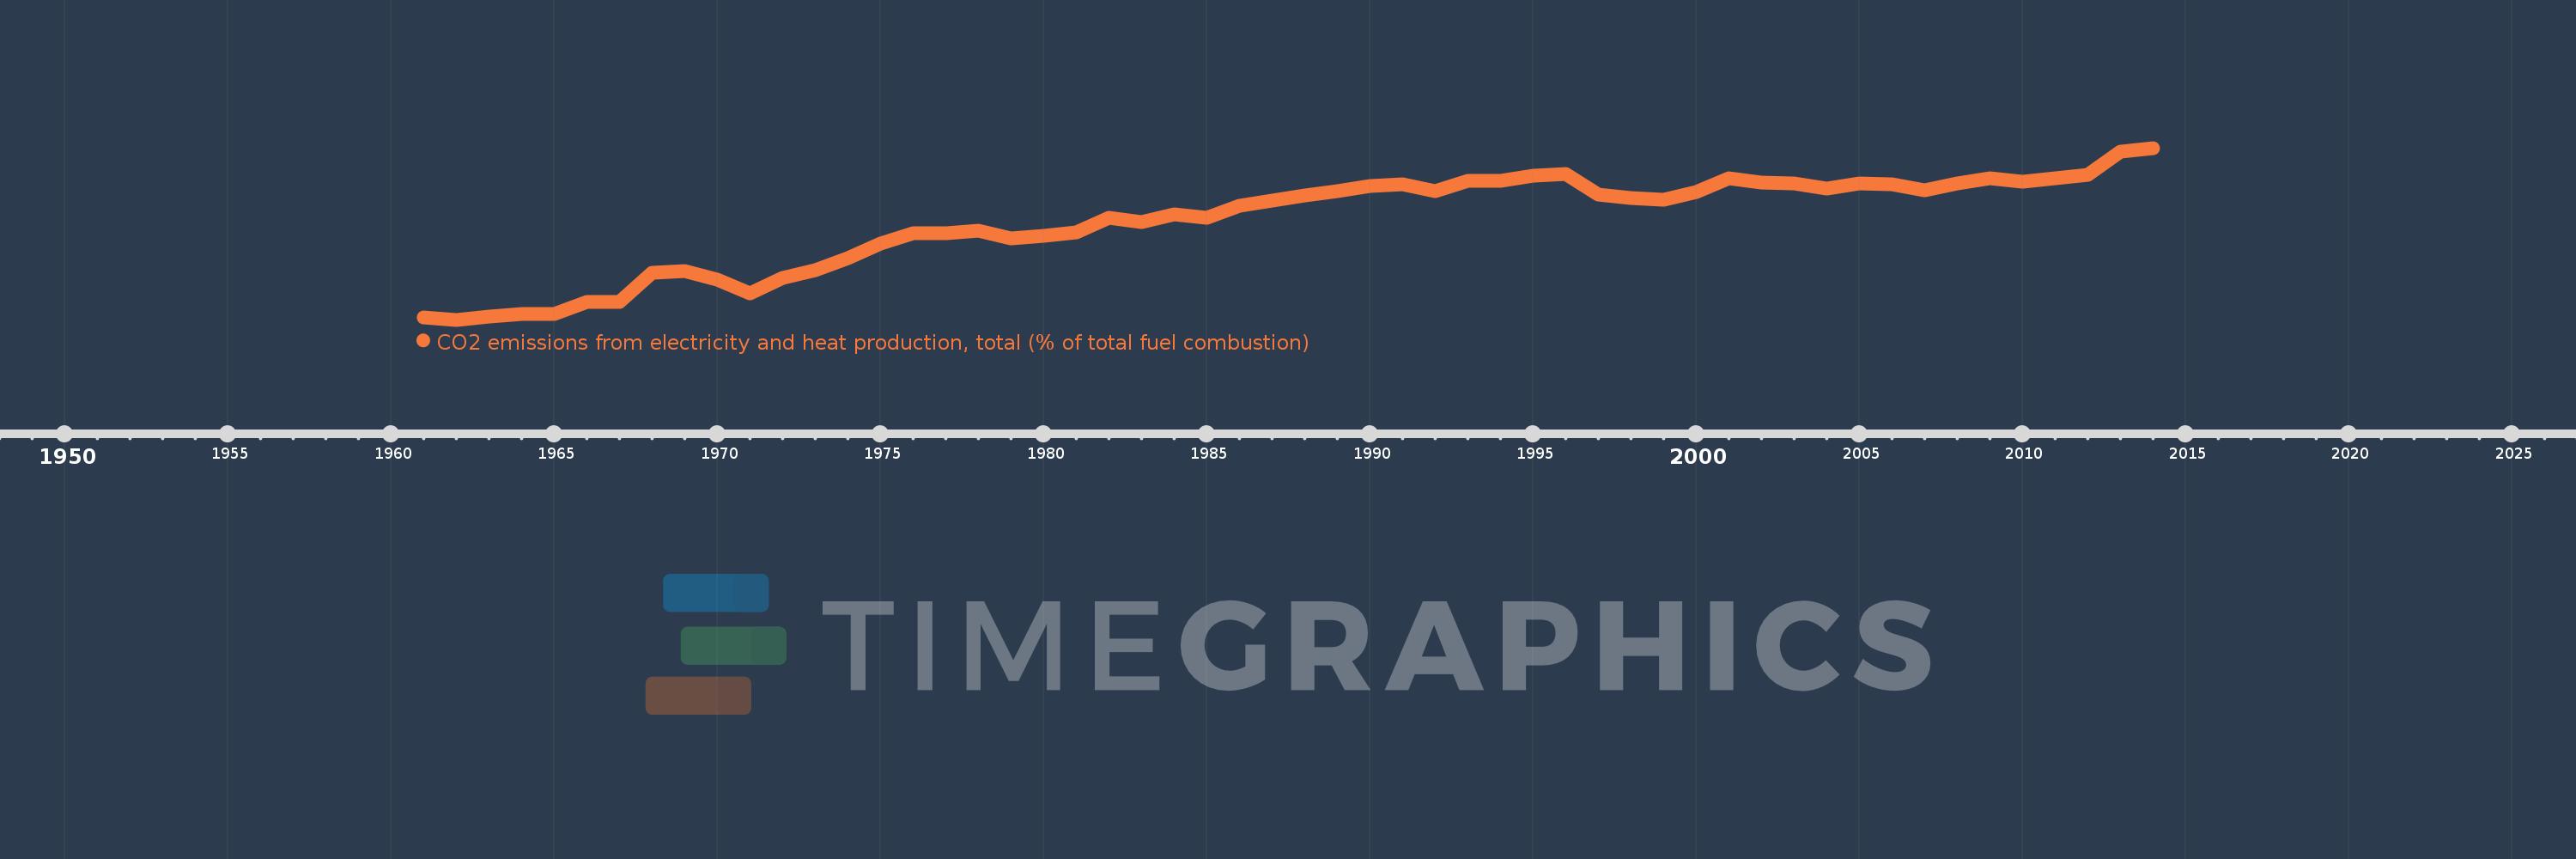
CO2 emissions from electricity and heat production, total (% of total fuel combustion)
2014,2013,2012,2011,2010,2009,2008,2007,2006,2005,2004,2003,2002,2001,2000,1999,1998,1997,1996,1995,1994,1993,1992,1991,1990,1989,1988,1987,1986,1985,1984,1983,1982,1981,1980,1979,1978,1977,1976,1975,1974,1973,1972,1971,1970,1969,1968,1967,1966,1965,1964,1963,1962,1961
Estas estatísticas em outros países:
AlbaniaAlgeriaAngolaArab WorldArgentinaArmeniaAustraliaAustriaAzerbaijanBahrainBangladeshBelarusBelgiumBeninBoliviaBosnia and HerzegovinaBotswanaBrazilBrunei DarussalamBulgariaCambodiaCameroonCanadaCaribbean small statesCentral Europe and the BalticsChileChinaColombiaCongo, Dem. Rep.Congo, Rep.Costa RicaCote d'IvoireCroatiaCubaCuracaoCyprusCzech RepublicDenmarkDominican RepublicEarly-demographic dividendEast Asia & PacificEast Asia & Pacific (excluding high income)East Asia & Pacific (IDA & IBRD countries)EcuadorEgypt, Arab Rep.El SalvadorEritreaEstoniaEthiopiaEuro areaEurope & Central AsiaEurope & Central Asia (excluding high income)Europe & Central Asia (IDA & IBRD countries)European UnionFinlandFragile and conflict affected situationsFranceGabonGeorgiaGermanyGhanaGibraltarGreeceGuatemalaHaitiHeavily indebted poor countries (HIPC)High incomeHondurasHong Kong SAR, ChinaHungaryIBRD onlyIcelandIDA & IBRD totalIDA blendIDA onlyIDA totalIndiaIndonesiaIran, Islamic Rep.IraqIrelandIsraelItalyJamaicaJapanJordanKazakhstanKenyaKorea, Dem. People’s Rep.Korea, Rep.KosovoKuwaitKyrgyz RepublicLate-demographic dividendLatin America & Caribbean Latin America & Caribbean (excluding high income)Latin America & the Caribbean (IDA & IBRD countries)LatviaLeast developed countries: UN classificationLebanonLibyaLithuaniaLow & middle incomeLow incomeLower middle incomeLuxembourgMacedonia, FYRMalaysiaMaltaMauritiusMexicoMiddle East & North AfricaMiddle East & North Africa (excluding high income)Middle East & North Africa (IDA & IBRD countries)Middle incomeMoldovaMongoliaMontenegroMoroccoMozambiqueMyanmarNamibiaNepalNetherlandsNew ZealandNicaraguaNigerNigeriaNorth AmericaNorwayOECD membersOmanOther small statesPakistanPanamaParaguayPeruPhilippinesPolandPortugalPost-demographic dividendPre-demographic dividendQatarRomaniaRussian FederationSaudi ArabiaSenegalSerbiaSingaporeSlovak RepublicSloveniaSmall statesSouth AfricaSouth AsiaSouth Asia (IDA & IBRD)South SudanSpainSri LankaSub-Saharan Africa Sub-Saharan Africa (excluding high income)Sub-Saharan Africa (IDA & IBRD countries)SudanSwedenSwitzerlandSyrian Arab RepublicTajikistanTanzaniaThailandTogoTrinidad and TobagoTunisiaTurkeyTurkmenistanUkraineUnited Arab EmiratesUnited KingdomUnited StatesUpper middle incomeUruguayUzbekistanVenezuela, RBVietnamWorldYemen, Rep.ZambiaZimbabwe Linha do tempo:
Nesta escala de tempo está apresentado um gráfico de 1961 ano até 2014 ano Greece. Dados de 1960 ano ausente. O número de observações reais por data: 54.
Fonte (nome):
Indicadores de desenvolvimento mundial
Fonte (organização):
IEA Statistics © OECD/IEA 2014 (http://www.iea.org/stats/index.asp), subject to https://www.iea.org/t&c/termsandconditions/
Categorias:
Environment
Foi atualizado:
23 abr 2017 ano
Indicadores de alterações dos valores ao longo dos anos
Mínimo:
26.474
1 jan 1962 ano
Máximo:
60.328
1 jan 2014 ano
Na data de observação
Valor
Mudança absoluta
A alteração em relação ao valor anterior
1 jan 1961 ano
26.913
+26.913
0.0%
1 jan 1962 ano
26.474
-0.438
-1.63%
1 jan 1963 ano
27.171
+0.697
2.63%
1 jan 1964 ano
27.622
+0.451
1.66%
1 jan 1965 ano
27.568
-0.054
-0.2%
1 jan 1966 ano
29.961
+2.393
8.68%
1 jan 1967 ano
30.007
+0.046
0.15%
1 jan 1968 ano
35.665
+5.658
18.85%
1 jan 1969 ano
36.098
+0.433
1.22%
1 jan 1970 ano
34.357
-1.741
-4.82%
1 jan 1971 ano
31.699
-2.658
-7.74%
1 jan 1972 ano
34.796
+3.097
9.77%
1 jan 1973 ano
36.317
+1.52
4.37%
1 jan 1974 ano
38.671
+2.355
6.48%
1 jan 1975 ano
41.476
+2.804
7.25%
1 jan 1976 ano
43.548
+2.073
5.0%
1 jan 1977 ano
43.523
-0.025
-0.06%
1 jan 1978 ano
43.98
+0.457
1.05%
1 jan 1979 ano
42.569
-1.411
-3.21%
1 jan 1980 ano
42.949
+0.38
0.89%
1 jan 1981 ano
43.771
+0.821
1.91%
1 jan 1982 ano
46.564
+2.793
6.38%
1 jan 1983 ano
45.779
-0.785
-1.69%
1 jan 1984 ano
47.162
+1.383
3.02%
1 jan 1985 ano
46.608
-0.554
-1.17%
1 jan 1986 ano
49.0
+2.393
5.13%
1 jan 1987 ano
49.982
+0.981
2.0%
1 jan 1988 ano
51.011
+1.029
2.06%
1 jan 1989 ano
51.84
+0.829
1.63%
1 jan 1990 ano
52.805
+0.965
1.86%
1 jan 1991 ano
53.133
+0.328
0.62%
1 jan 1992 ano
51.875
-1.258
-2.37%
1 jan 1993 ano
53.773
+1.898
3.66%
1 jan 1994 ano
53.903
+0.13
0.24%
1 jan 1995 ano
54.785
+0.883
1.64%
1 jan 1996 ano
55.142
+0.356
0.65%
1 jan 1997 ano
51.093
-4.049
-7.34%
1 jan 1998 ano
50.465
-0.627
-1.23%
1 jan 1999 ano
50.13
-0.335
-0.66%
1 jan 2000 ano
51.628
+1.498
2.99%
1 jan 2001 ano
54.319
+2.691
5.21%
1 jan 2002 ano
53.541
-0.779
-1.43%
1 jan 2003 ano
53.277
-0.264
-0.49%
1 jan 2004 ano
52.396
-0.88
-1.65%
1 jan 2005 ano
53.421
+1.025
1.96%
1 jan 2006 ano
53.23
-0.191
-0.36%
1 jan 2007 ano
51.949
-1.281
-2.41%
1 jan 2008 ano
53.287
+1.338
2.58%
1 jan 2009 ano
54.322
+1.035
1.94%
1 jan 2010 ano
53.608
-0.714
-1.31%
1 jan 2011 ano
54.304
+0.695
1.3%
1 jan 2012 ano
55.105
+0.802
1.48%
1 jan 2013 ano
59.556
+4.451
8.08%
1 jan 2014 ano
60.328
+0.772
1.3%
Classificação de países por estatísticas atuais por anos


Comentários: