29
/pt/
pt
AIzaSyAYiBZKx7MnpbEhh9jyipgxe19OcubqV5w
April 1, 2024
56086
Small states
SST
false
2
1
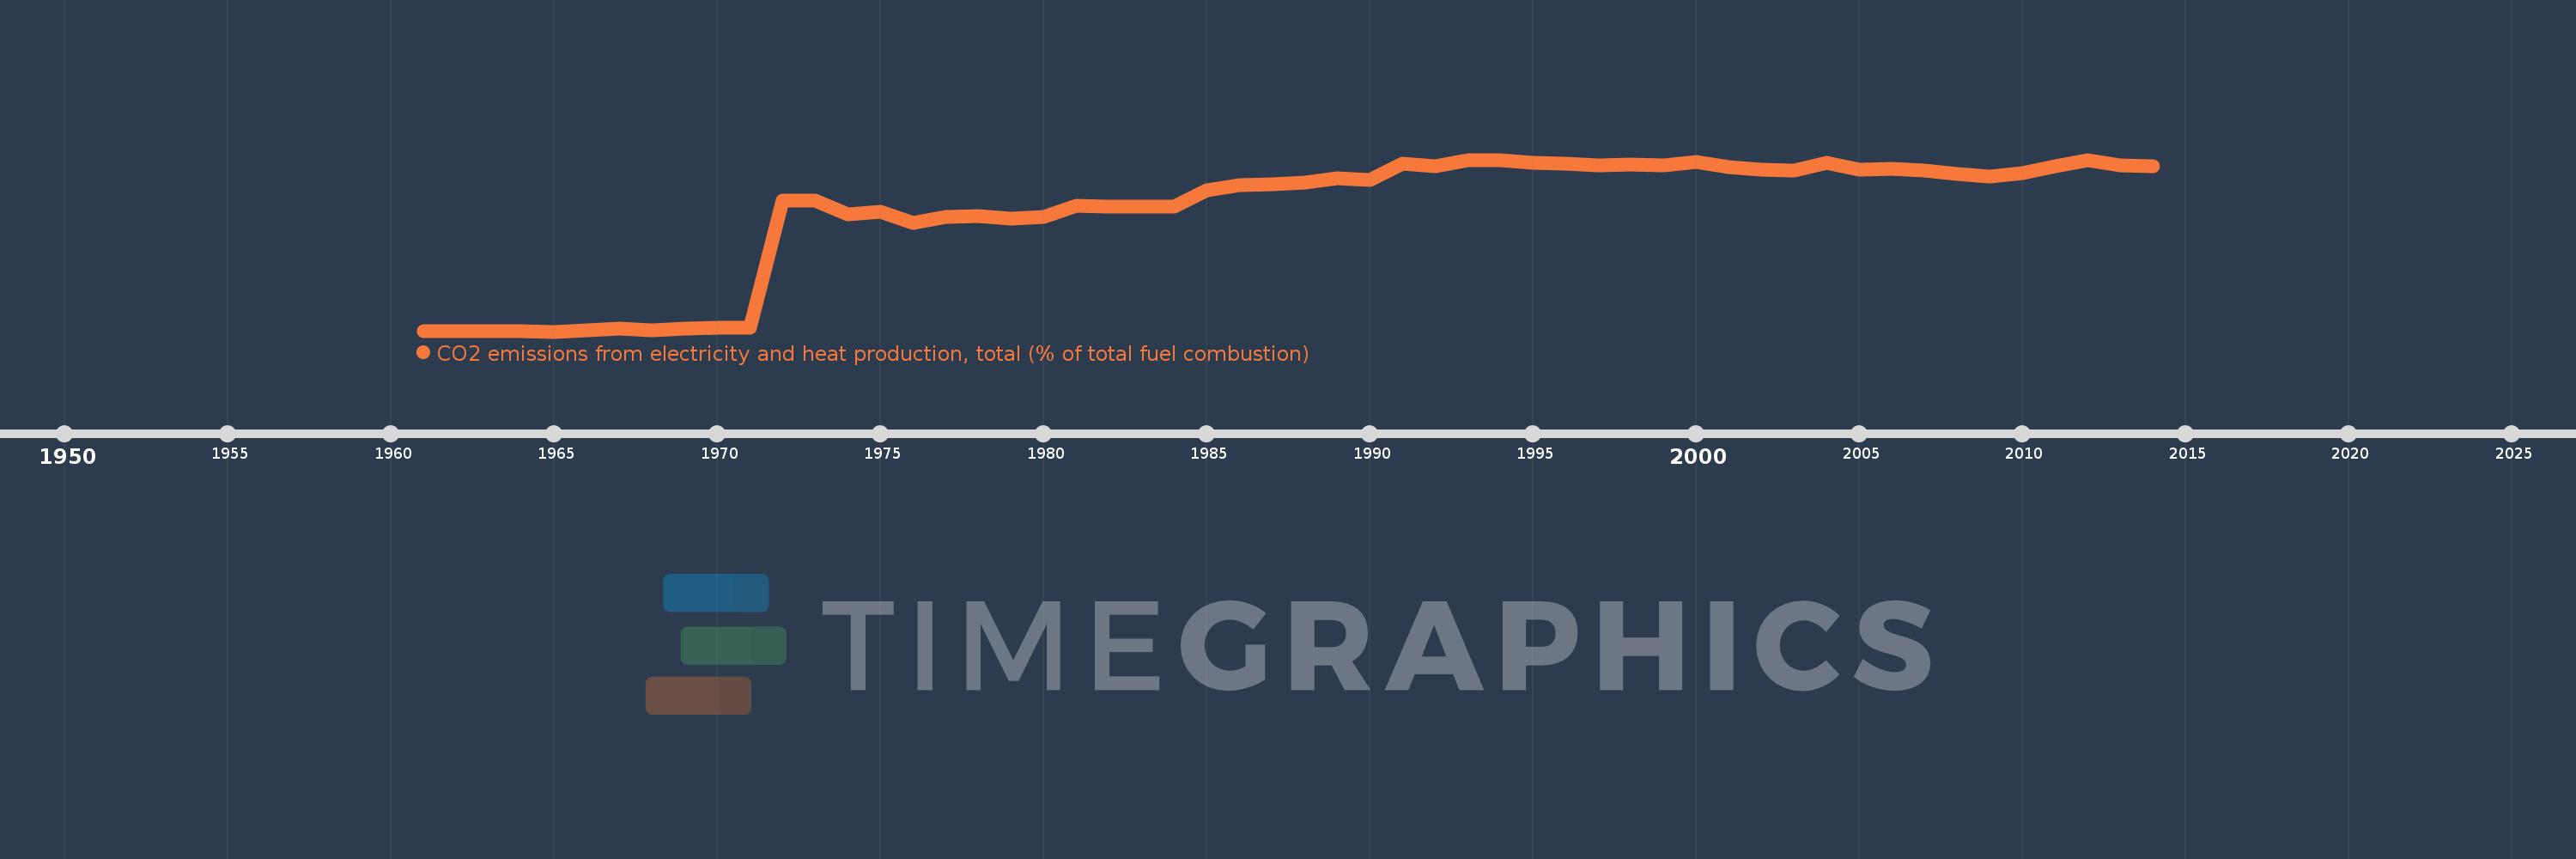
CO2 emissions from electricity and heat production, total (% of total fuel combustion)
2014,2013,2012,2011,2010,2009,2008,2007,2006,2005,2004,2003,2002,2001,2000,1999,1998,1997,1996,1995,1994,1993,1992,1991,1990,1989,1988,1987,1986,1985,1984,1983,1982,1981,1980,1979,1978,1977,1976,1975,1974,1973,1972,1971,1970,1969,1968,1967,1966,1965,1964,1963,1962,1961
Estas estatísticas em outros países:
AlbaniaAlgeriaAngolaArab WorldArgentinaArmeniaAustraliaAustriaAzerbaijanBahrainBangladeshBelarusBelgiumBeninBoliviaBosnia and HerzegovinaBotswanaBrazilBrunei DarussalamBulgariaCambodiaCameroonCanadaCaribbean small statesCentral Europe and the BalticsChileChinaColombiaCongo, Dem. Rep.Congo, Rep.Costa RicaCote d'IvoireCroatiaCubaCuracaoCyprusCzech RepublicDenmarkDominican RepublicEarly-demographic dividendEast Asia & PacificEast Asia & Pacific (excluding high income)East Asia & Pacific (IDA & IBRD countries)EcuadorEgypt, Arab Rep.El SalvadorEritreaEstoniaEthiopiaEuro areaEurope & Central AsiaEurope & Central Asia (excluding high income)Europe & Central Asia (IDA & IBRD countries)European UnionFinlandFragile and conflict affected situationsFranceGabonGeorgiaGermanyGhanaGibraltarGreeceGuatemalaHaitiHeavily indebted poor countries (HIPC)High incomeHondurasHong Kong SAR, ChinaHungaryIBRD onlyIcelandIDA & IBRD totalIDA blendIDA onlyIDA totalIndiaIndonesiaIran, Islamic Rep.IraqIrelandIsraelItalyJamaicaJapanJordanKazakhstanKenyaKorea, Dem. People’s Rep.Korea, Rep.KosovoKuwaitKyrgyz RepublicLate-demographic dividendLatin America & Caribbean Latin America & Caribbean (excluding high income)Latin America & the Caribbean (IDA & IBRD countries)LatviaLeast developed countries: UN classificationLebanonLibyaLithuaniaLow & middle incomeLow incomeLower middle incomeLuxembourgMacedonia, FYRMalaysiaMaltaMauritiusMexicoMiddle East & North AfricaMiddle East & North Africa (excluding high income)Middle East & North Africa (IDA & IBRD countries)Middle incomeMoldovaMongoliaMontenegroMoroccoMozambiqueMyanmarNamibiaNepalNetherlandsNew ZealandNicaraguaNigerNigeriaNorth AmericaNorwayOECD membersOmanOther small statesPakistanPanamaParaguayPeruPhilippinesPolandPortugalPost-demographic dividendPre-demographic dividendQatarRomaniaRussian FederationSaudi ArabiaSenegalSerbiaSingaporeSlovak RepublicSloveniaSmall statesSouth AfricaSouth AsiaSouth Asia (IDA & IBRD)South SudanSpainSri LankaSub-Saharan Africa Sub-Saharan Africa (excluding high income)Sub-Saharan Africa (IDA & IBRD countries)SudanSwedenSwitzerlandSyrian Arab RepublicTajikistanTanzaniaThailandTogoTrinidad and TobagoTunisiaTurkeyTurkmenistanUkraineUnited Arab EmiratesUnited KingdomUnited StatesUpper middle incomeUruguayUzbekistanVenezuela, RBVietnamWorldYemen, Rep.ZambiaZimbabwe Linha do tempo:
Nesta escala de tempo está apresentado um gráfico de 1961 ano até 2014 ano Small states. Dados de 1960 ano ausente. O número de observações reais por data: 54.
Fonte (nome):
Indicadores de desenvolvimento mundial
Fonte (organização):
IEA Statistics © OECD/IEA 2014 (http://www.iea.org/stats/index.asp), subject to https://www.iea.org/t&c/termsandconditions/
Categorias:
Environment
Foi atualizado:
23 abr 2017 ano
Indicadores de alterações dos valores ao longo dos anos
Mínimo:
0.775
1 jan 1965 ano
Máximo:
67.003
1 jan 1994 ano
Na data de observação
Valor
Mudança absoluta
A alteração em relação ao valor anterior
1 jan 1961 ano
0.855
+0.855
0.0%
1 jan 1962 ano
0.87
+0.015
1.74%
1 jan 1963 ano
0.806
-0.063
-7.26%
1 jan 1964 ano
0.787
-0.019
-2.36%
1 jan 1965 ano
0.775
-0.012
-1.55%
1 jan 1966 ano
1.429
+0.653
84.29%
1 jan 1967 ano
2.0
+0.571
40.0%
1 jan 1968 ano
1.408
-0.592
-29.58%
1 jan 1969 ano
2.013
+0.605
42.95%
1 jan 1970 ano
2.256
+0.242
12.03%
1 jan 1971 ano
2.273
+0.017
0.76%
1 jan 1972 ano
51.336
+49.063
2.16 mil%
1 jan 1973 ano
51.371
+0.035
0.07%
1 jan 1974 ano
45.847
-5.525
-10.75%
1 jan 1975 ano
46.855
+1.008
2.2%
1 jan 1976 ano
42.663
-4.192
-8.95%
1 jan 1977 ano
44.986
+2.323
5.44%
1 jan 1978 ano
45.273
+0.287
0.64%
1 jan 1979 ano
44.263
-1.01
-2.23%
1 jan 1980 ano
45.13
+0.867
1.96%
1 jan 1981 ano
49.188
+4.058
8.99%
1 jan 1982 ano
48.856
-0.332
-0.67%
1 jan 1983 ano
49.043
+0.187
0.38%
1 jan 1984 ano
48.932
-0.111
-0.23%
1 jan 1985 ano
55.341
+6.41
13.1%
1 jan 1986 ano
57.363
+2.022
3.65%
1 jan 1987 ano
57.731
+0.367
0.64%
1 jan 1988 ano
58.312
+0.581
1.01%
1 jan 1989 ano
59.892
+1.58
2.71%
1 jan 1990 ano
59.163
-0.729
-1.22%
1 jan 1991 ano
65.366
+6.203
10.48%
1 jan 1992 ano
64.68
-0.686
-1.05%
1 jan 1993 ano
66.915
+2.235
3.46%
1 jan 1994 ano
67.003
+0.088
0.13%
1 jan 1995 ano
65.932
-1.071
-1.6%
1 jan 1996 ano
65.606
-0.326
-0.49%
1 jan 1997 ano
64.705
-0.901
-1.37%
1 jan 1998 ano
65.066
+0.36
0.56%
1 jan 1999 ano
64.937
-0.129
-0.2%
1 jan 2000 ano
66.234
+1.297
2.0%
1 jan 2001 ano
64.255
-1.98
-2.99%
1 jan 2002 ano
63.347
-0.908
-1.41%
1 jan 2003 ano
62.755
-0.592
-0.93%
1 jan 2004 ano
65.834
+3.078
4.91%
1 jan 2005 ano
63.324
-2.51
-3.81%
1 jan 2006 ano
63.672
+0.348
0.55%
1 jan 2007 ano
62.833
-0.838
-1.32%
1 jan 2008 ano
61.413
-1.421
-2.26%
1 jan 2009 ano
60.557
-0.856
-1.39%
1 jan 2010 ano
61.963
+1.406
2.32%
1 jan 2011 ano
64.364
+2.402
3.88%
1 jan 2012 ano
66.884
+2.519
3.91%
1 jan 2013 ano
64.767
-2.116
-3.16%
1 jan 2014 ano
64.491
-0.276
-0.43%
Classificação de países por estatísticas atuais por anos


Comentários: