29
/pt/
pt
AIzaSyAYiBZKx7MnpbEhh9jyipgxe19OcubqV5w
April 1, 2024
30513
Europe & Central Asia
ECS
false
2
1
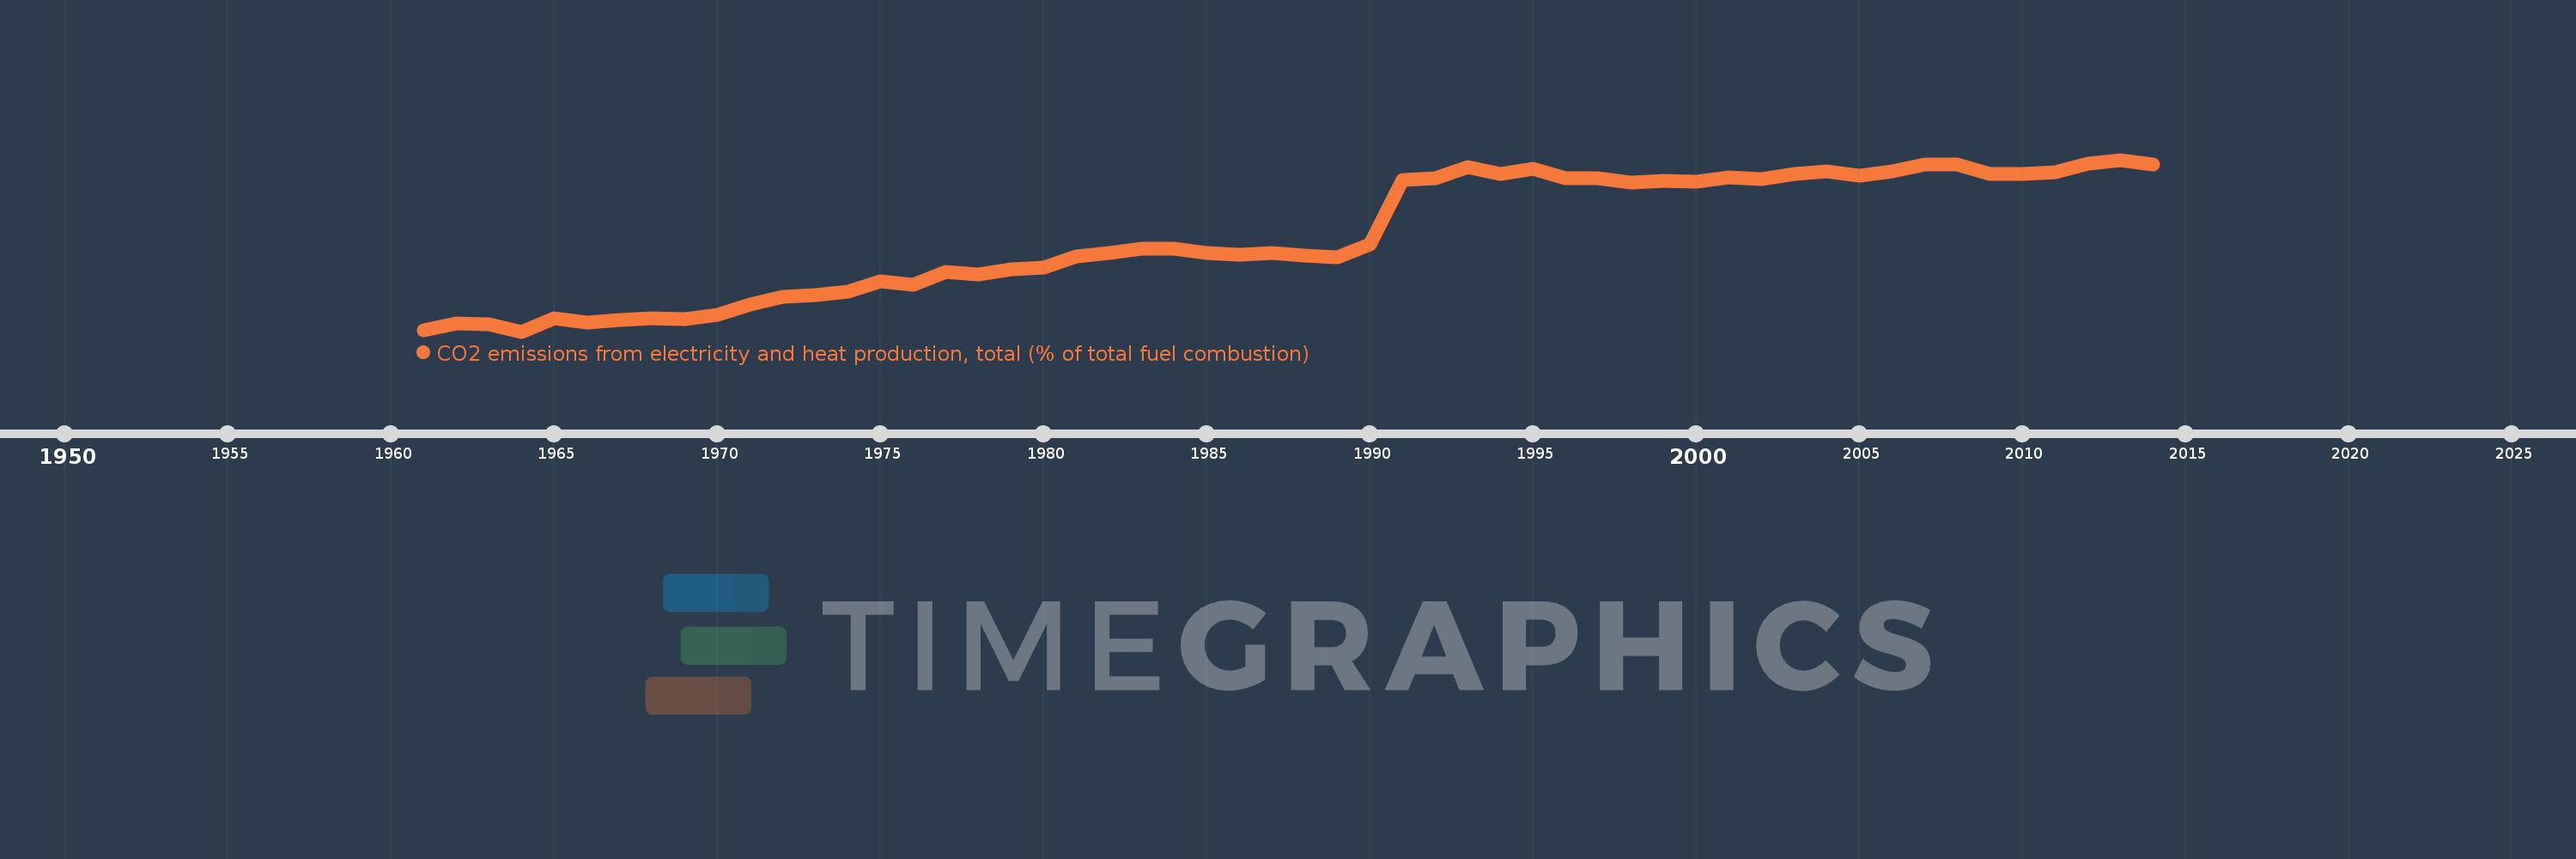
CO2 emissions from electricity and heat production, total (% of total fuel combustion)
2014,2013,2012,2011,2010,2009,2008,2007,2006,2005,2004,2003,2002,2001,2000,1999,1998,1997,1996,1995,1994,1993,1992,1991,1990,1989,1988,1987,1986,1985,1984,1983,1982,1981,1980,1979,1978,1977,1976,1975,1974,1973,1972,1971,1970,1969,1968,1967,1966,1965,1964,1963,1962,1961
Estas estatísticas em outros países:
AlbaniaAlgeriaAngolaArab WorldArgentinaArmeniaAustraliaAustriaAzerbaijanBahrainBangladeshBelarusBelgiumBeninBoliviaBosnia and HerzegovinaBotswanaBrazilBrunei DarussalamBulgariaCambodiaCameroonCanadaCaribbean small statesCentral Europe and the BalticsChileChinaColombiaCongo, Dem. Rep.Congo, Rep.Costa RicaCote d'IvoireCroatiaCubaCuracaoCyprusCzech RepublicDenmarkDominican RepublicEarly-demographic dividendEast Asia & PacificEast Asia & Pacific (excluding high income)East Asia & Pacific (IDA & IBRD countries)EcuadorEgypt, Arab Rep.El SalvadorEritreaEstoniaEthiopiaEuro areaEurope & Central AsiaEurope & Central Asia (excluding high income)Europe & Central Asia (IDA & IBRD countries)European UnionFinlandFragile and conflict affected situationsFranceGabonGeorgiaGermanyGhanaGibraltarGreeceGuatemalaHaitiHeavily indebted poor countries (HIPC)High incomeHondurasHong Kong SAR, ChinaHungaryIBRD onlyIcelandIDA & IBRD totalIDA blendIDA onlyIDA totalIndiaIndonesiaIran, Islamic Rep.IraqIrelandIsraelItalyJamaicaJapanJordanKazakhstanKenyaKorea, Dem. People’s Rep.Korea, Rep.KosovoKuwaitKyrgyz RepublicLate-demographic dividendLatin America & Caribbean Latin America & Caribbean (excluding high income)Latin America & the Caribbean (IDA & IBRD countries)LatviaLeast developed countries: UN classificationLebanonLibyaLithuaniaLow & middle incomeLow incomeLower middle incomeLuxembourgMacedonia, FYRMalaysiaMaltaMauritiusMexicoMiddle East & North AfricaMiddle East & North Africa (excluding high income)Middle East & North Africa (IDA & IBRD countries)Middle incomeMoldovaMongoliaMontenegroMoroccoMozambiqueMyanmarNamibiaNepalNetherlandsNew ZealandNicaraguaNigerNigeriaNorth AmericaNorwayOECD membersOmanOther small statesPakistanPanamaParaguayPeruPhilippinesPolandPortugalPost-demographic dividendPre-demographic dividendQatarRomaniaRussian FederationSaudi ArabiaSenegalSerbiaSingaporeSlovak RepublicSloveniaSmall statesSouth AfricaSouth AsiaSouth Asia (IDA & IBRD)South SudanSpainSri LankaSub-Saharan Africa Sub-Saharan Africa (excluding high income)Sub-Saharan Africa (IDA & IBRD countries)SudanSwedenSwitzerlandSyrian Arab RepublicTajikistanTanzaniaThailandTogoTrinidad and TobagoTunisiaTurkeyTurkmenistanUkraineUnited Arab EmiratesUnited KingdomUnited StatesUpper middle incomeUruguayUzbekistanVenezuela, RBVietnamWorldYemen, Rep.ZambiaZimbabwe Linha do tempo:
Nesta escala de tempo está apresentado um gráfico de 1961 ano até 2014 ano Europe & Central Asia. Dados de 1960 ano ausente. O número de observações reais por data: 54.
Fonte (nome):
Indicadores de desenvolvimento mundial
Fonte (organização):
IEA Statistics © OECD/IEA 2014 (http://www.iea.org/stats/index.asp), subject to https://www.iea.org/t&c/termsandconditions/
Categorias:
Environment
Foi atualizado:
23 abr 2017 ano
Indicadores de alterações dos valores ao longo dos anos
Mínimo:
30.429
1 jan 1964 ano
Máximo:
49.534
1 jan 2013 ano
Na data de observação
Valor
Mudança absoluta
A alteração em relação ao valor anterior
1 jan 1961 ano
30.567
+30.567
0.0%
1 jan 1962 ano
31.311
+0.745
2.44%
1 jan 1963 ano
31.198
-0.114
-0.36%
1 jan 1964 ano
30.429
-0.768
-2.46%
1 jan 1965 ano
31.917
+1.488
4.89%
1 jan 1966 ano
31.476
-0.441
-1.38%
1 jan 1967 ano
31.755
+0.279
0.89%
1 jan 1968 ano
31.947
+0.192
0.61%
1 jan 1969 ano
31.855
-0.092
-0.29%
1 jan 1970 ano
32.251
+0.396
1.24%
1 jan 1971 ano
33.45
+1.198
3.72%
1 jan 1972 ano
34.275
+0.826
2.47%
1 jan 1973 ano
34.446
+0.171
0.5%
1 jan 1974 ano
34.852
+0.405
1.18%
1 jan 1975 ano
36.012
+1.16
3.33%
1 jan 1976 ano
35.66
-0.352
-0.98%
1 jan 1977 ano
37.035
+1.375
3.86%
1 jan 1978 ano
36.808
-0.227
-0.61%
1 jan 1979 ano
37.324
+0.516
1.4%
1 jan 1980 ano
37.504
+0.18
0.48%
1 jan 1981 ano
38.787
+1.284
3.42%
1 jan 1982 ano
39.134
+0.347
0.89%
1 jan 1983 ano
39.684
+0.55
1.41%
1 jan 1984 ano
39.661
-0.023
-0.06%
1 jan 1985 ano
39.167
-0.494
-1.25%
1 jan 1986 ano
38.945
-0.222
-0.57%
1 jan 1987 ano
39.188
+0.242
0.62%
1 jan 1988 ano
38.909
-0.278
-0.71%
1 jan 1989 ano
38.679
-0.231
-0.59%
1 jan 1990 ano
40.165
+1.486
3.84%
1 jan 1991 ano
47.277
+7.112
17.71%
1 jan 1992 ano
47.492
+0.216
0.46%
1 jan 1993 ano
48.696
+1.204
2.53%
1 jan 1994 ano
48.0
-0.696
-1.43%
1 jan 1995 ano
48.533
+0.533
1.11%
1 jan 1996 ano
47.504
-1.03
-2.12%
1 jan 1997 ano
47.469
-0.034
-0.07%
1 jan 1998 ano
47.037
-0.433
-0.91%
1 jan 1999 ano
47.234
+0.197
0.42%
1 jan 2000 ano
47.08
-0.154
-0.33%
1 jan 2001 ano
47.537
+0.456
0.97%
1 jan 2002 ano
47.432
-0.105
-0.22%
1 jan 2003 ano
48.004
+0.572
1.21%
1 jan 2004 ano
48.248
+0.245
0.51%
1 jan 2005 ano
47.757
-0.492
-1.02%
1 jan 2006 ano
48.289
+0.533
1.12%
1 jan 2007 ano
48.998
+0.708
1.47%
1 jan 2008 ano
48.961
-0.037
-0.08%
1 jan 2009 ano
47.966
-0.995
-2.03%
1 jan 2010 ano
47.996
+0.03
0.06%
1 jan 2011 ano
48.143
+0.147
0.31%
1 jan 2012 ano
49.071
+0.928
1.93%
1 jan 2013 ano
49.534
+0.463
0.94%
1 jan 2014 ano
49.014
-0.519
-1.05%
Classificação de países por estatísticas atuais por anos


Comentários: