29
/pt/
pt
AIzaSyAYiBZKx7MnpbEhh9jyipgxe19OcubqV5w
April 1, 2024
116369
Curacao
CUW
true
2
1
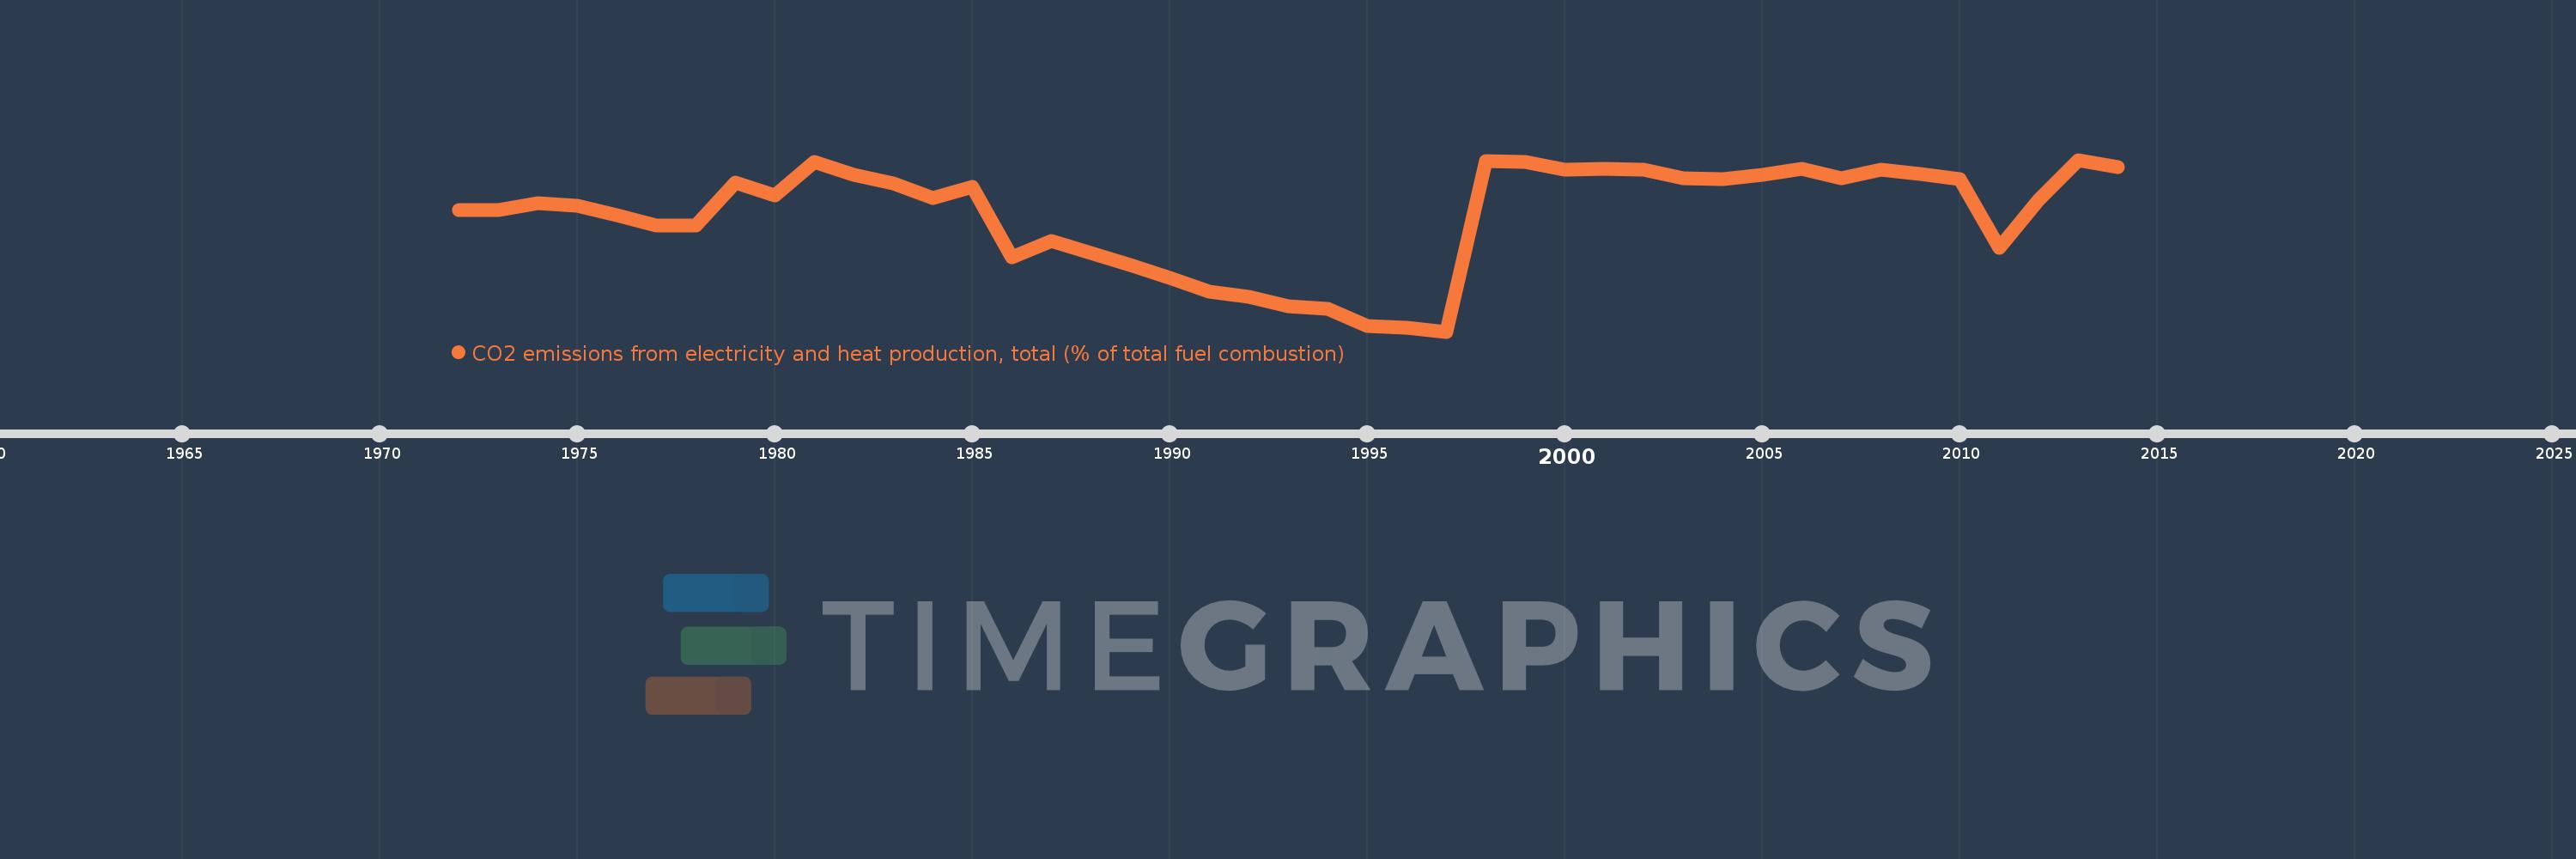
CO2 emissions from electricity and heat production, total (% of total fuel combustion)
2014,2013,2012,2011,2010,2009,2008,2007,2006,2005,2004,2003,2002,2001,2000,1999,1998,1997,1996,1995,1994,1993,1992,1991,1990,1989,1988,1987,1986,1985,1984,1983,1982,1981,1980,1979,1978,1977,1976,1975,1974,1973,1972
Estas estatísticas em outros países:
AlbaniaAlgeriaAngolaArab WorldArgentinaArmeniaAustraliaAustriaAzerbaijanBahrainBangladeshBelarusBelgiumBeninBoliviaBosnia and HerzegovinaBotswanaBrazilBrunei DarussalamBulgariaCambodiaCameroonCanadaCaribbean small statesCentral Europe and the BalticsChileChinaColombiaCongo, Dem. Rep.Congo, Rep.Costa RicaCote d'IvoireCroatiaCubaCuracaoCyprusCzech RepublicDenmarkDominican RepublicEarly-demographic dividendEast Asia & PacificEast Asia & Pacific (excluding high income)East Asia & Pacific (IDA & IBRD countries)EcuadorEgypt, Arab Rep.El SalvadorEritreaEstoniaEthiopiaEuro areaEurope & Central AsiaEurope & Central Asia (excluding high income)Europe & Central Asia (IDA & IBRD countries)European UnionFinlandFragile and conflict affected situationsFranceGabonGeorgiaGermanyGhanaGibraltarGreeceGuatemalaHaitiHeavily indebted poor countries (HIPC)High incomeHondurasHong Kong SAR, ChinaHungaryIBRD onlyIcelandIDA & IBRD totalIDA blendIDA onlyIDA totalIndiaIndonesiaIran, Islamic Rep.IraqIrelandIsraelItalyJamaicaJapanJordanKazakhstanKenyaKorea, Dem. People’s Rep.Korea, Rep.KosovoKuwaitKyrgyz RepublicLate-demographic dividendLatin America & Caribbean Latin America & Caribbean (excluding high income)Latin America & the Caribbean (IDA & IBRD countries)LatviaLeast developed countries: UN classificationLebanonLibyaLithuaniaLow & middle incomeLow incomeLower middle incomeLuxembourgMacedonia, FYRMalaysiaMaltaMauritiusMexicoMiddle East & North AfricaMiddle East & North Africa (excluding high income)Middle East & North Africa (IDA & IBRD countries)Middle incomeMoldovaMongoliaMontenegroMoroccoMozambiqueMyanmarNamibiaNepalNetherlandsNew ZealandNicaraguaNigerNigeriaNorth AmericaNorwayOECD membersOmanOther small statesPakistanPanamaParaguayPeruPhilippinesPolandPortugalPost-demographic dividendPre-demographic dividendQatarRomaniaRussian FederationSaudi ArabiaSenegalSerbiaSingaporeSlovak RepublicSloveniaSmall statesSouth AfricaSouth AsiaSouth Asia (IDA & IBRD)South SudanSpainSri LankaSub-Saharan Africa Sub-Saharan Africa (excluding high income)Sub-Saharan Africa (IDA & IBRD countries)SudanSwedenSwitzerlandSyrian Arab RepublicTajikistanTanzaniaThailandTogoTrinidad and TobagoTunisiaTurkeyTurkmenistanUkraineUnited Arab EmiratesUnited KingdomUnited StatesUpper middle incomeUruguayUzbekistanVenezuela, RBVietnamWorldYemen, Rep.ZambiaZimbabwe Linha do tempo:
Nesta escala de tempo está apresentado um gráfico de 1972 ano até 2014 ano Curacao. Dados de 1971 ano ausente. O número de observações reais por data: 43.
Fonte (nome):
Indicadores de desenvolvimento mundial
Fonte (organização):
IEA Statistics © OECD/IEA 2014 (http://www.iea.org/stats/index.asp), subject to https://www.iea.org/t&c/termsandconditions/
Categorias:
Environment
Foi atualizado:
23 abr 2017 ano
Indicadores de alterações dos valores ao longo dos anos
Mínimo:
29.699
1 jan 1997 ano
Máximo:
65.646
1 jan 2013 ano
Na data de observação
Valor
Mudança absoluta
A alteração em relação ao valor anterior
1 jan 1972 ano
55.065
+55.065
0.0%
1 jan 1973 ano
55.067
+0.002
0.0%
1 jan 1974 ano
56.538
+1.471
2.67%
1 jan 1975 ano
56.02
-0.519
-0.92%
1 jan 1976 ano
53.974
-2.045
-3.65%
1 jan 1977 ano
51.937
-2.037
-3.77%
1 jan 1978 ano
51.821
-0.116
-0.22%
1 jan 1979 ano
60.841
+9.02
17.41%
1 jan 1980 ano
58.17
-2.671
-4.39%
1 jan 1981 ano
65.167
+6.997
12.03%
1 jan 1982 ano
62.438
-2.729
-4.19%
1 jan 1983 ano
60.768
-1.67
-2.67%
1 jan 1984 ano
57.625
-3.144
-5.17%
1 jan 1985 ano
59.94
+2.316
4.02%
1 jan 1986 ano
45.333
-14.607
-24.37%
1 jan 1987 ano
48.718
+3.385
7.47%
1 jan 1988 ano
46.212
-2.506
-5.14%
1 jan 1989 ano
43.642
-2.571
-5.56%
1 jan 1990 ano
41.017
-2.625
-6.01%
1 jan 1991 ano
37.97
-3.047
-7.43%
1 jan 1992 ano
36.957
-1.013
-2.67%
1 jan 1993 ano
34.965
-1.991
-5.39%
1 jan 1994 ano
34.483
-0.482
-1.38%
1 jan 1995 ano
30.798
-3.684
-10.68%
1 jan 1996 ano
30.418
-0.38
-1.23%
1 jan 1997 ano
29.699
-0.719
-2.36%
1 jan 1998 ano
65.465
+35.766
120.43%
1 jan 1999 ano
65.257
-0.208
-0.32%
1 jan 2000 ano
63.586
-1.671
-2.56%
1 jan 2001 ano
63.766
+0.18
0.28%
1 jan 2002 ano
63.573
-0.193
-0.3%
1 jan 2003 ano
61.792
-1.781
-2.8%
1 jan 2004 ano
61.679
-0.113
-0.18%
1 jan 2005 ano
62.478
+0.799
1.3%
1 jan 2006 ano
63.682
+1.203
1.93%
1 jan 2007 ano
61.785
-1.897
-2.98%
1 jan 2008 ano
63.566
+1.781
2.88%
1 jan 2009 ano
62.696
-0.87
-1.37%
1 jan 2010 ano
61.538
-1.157
-1.85%
1 jan 2011 ano
47.178
-14.36
-23.34%
1 jan 2012 ano
57.297
+10.119
21.45%
1 jan 2013 ano
65.646
+8.348
14.57%
1 jan 2014 ano
64.045
-1.601
-2.44%
Classificação de países por estatísticas atuais por anos


Comentários: