29
/pt/
pt
AIzaSyAYiBZKx7MnpbEhh9jyipgxe19OcubqV5w
April 1, 2024
248440
Sri Lanka
LKA
true
2
1
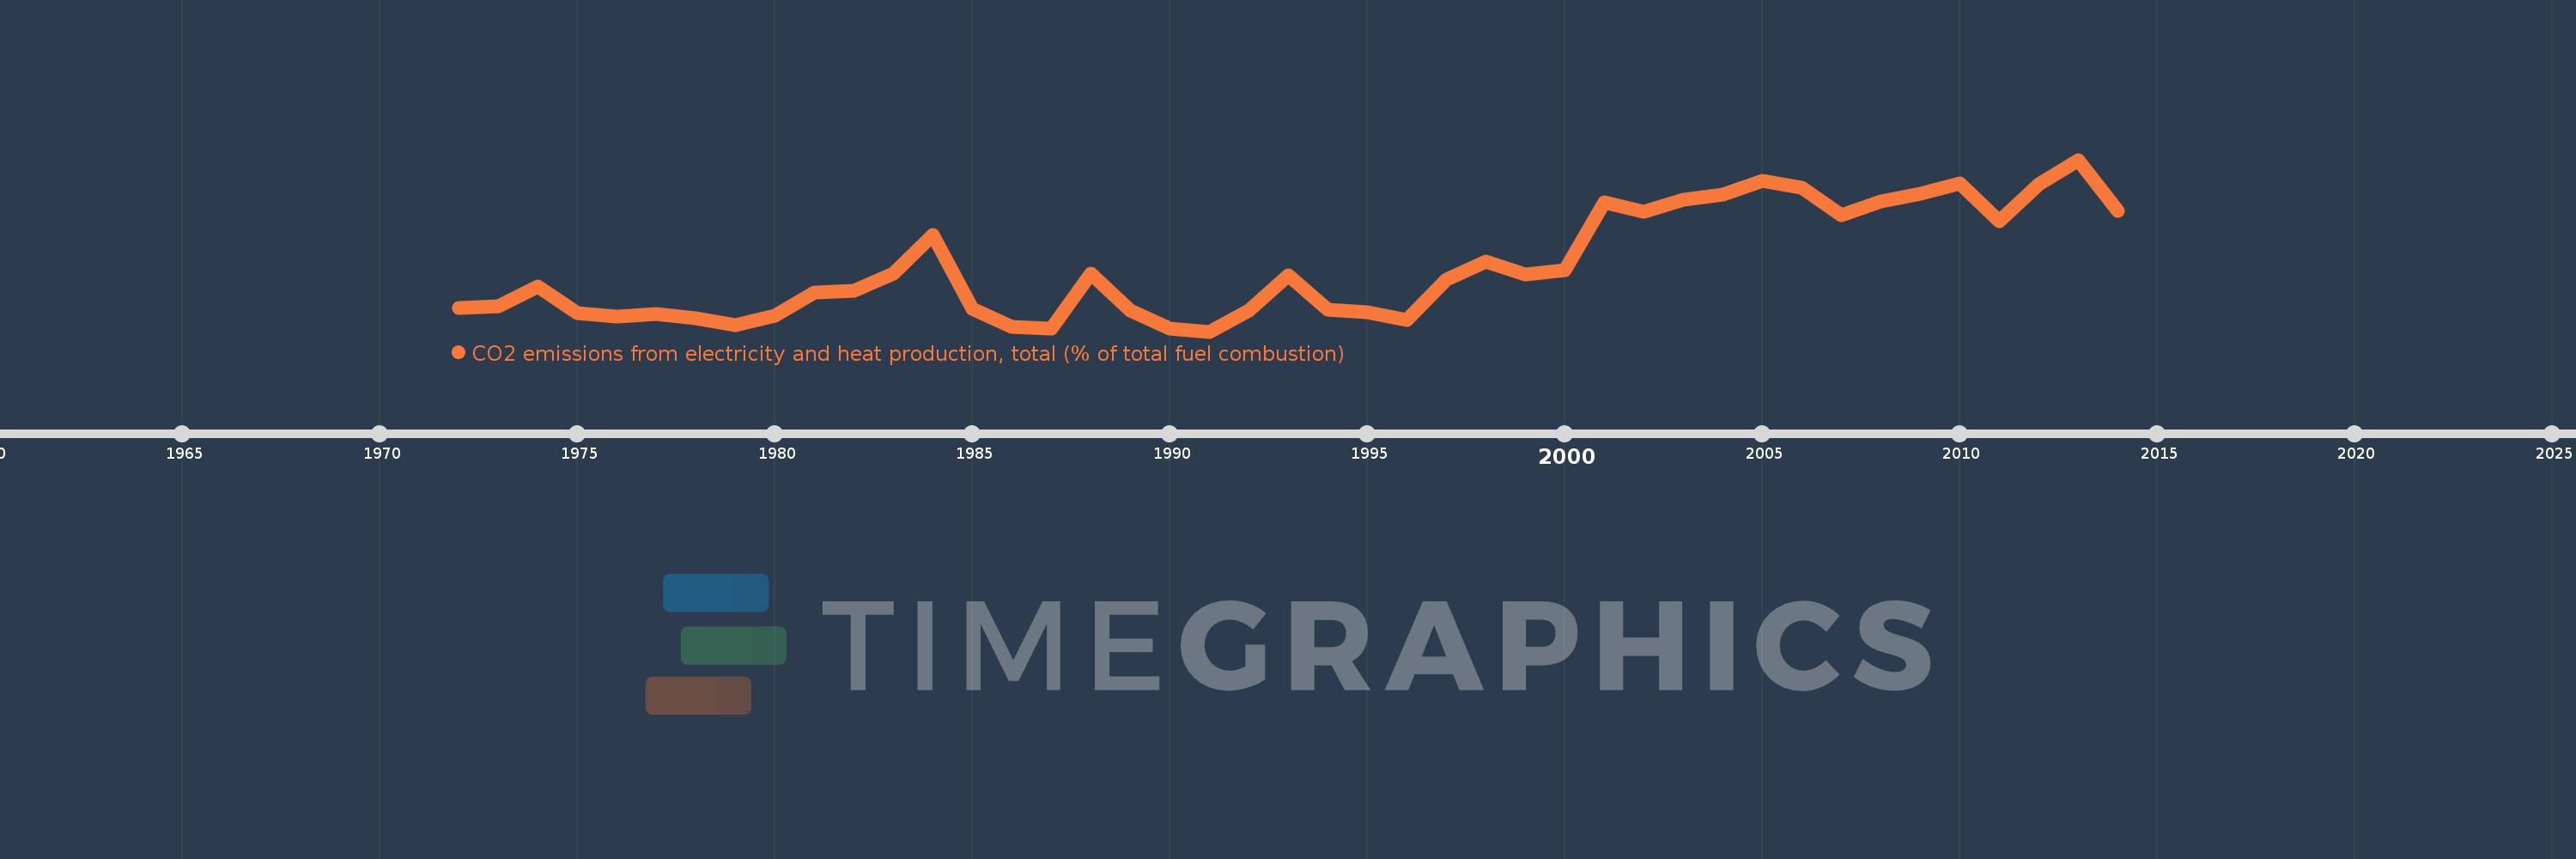
CO2 emissions from electricity and heat production, total (% of total fuel combustion)
2014,2013,2012,2011,2010,2009,2008,2007,2006,2005,2004,2003,2002,2001,2000,1999,1998,1997,1996,1995,1994,1993,1992,1991,1990,1989,1988,1987,1986,1985,1984,1983,1982,1981,1980,1979,1978,1977,1976,1975,1974,1973,1972
Estas estatísticas em outros países:
AlbaniaAlgeriaAngolaArab WorldArgentinaArmeniaAustraliaAustriaAzerbaijanBahrainBangladeshBelarusBelgiumBeninBoliviaBosnia and HerzegovinaBotswanaBrazilBrunei DarussalamBulgariaCambodiaCameroonCanadaCaribbean small statesCentral Europe and the BalticsChileChinaColombiaCongo, Dem. Rep.Congo, Rep.Costa RicaCote d'IvoireCroatiaCubaCuracaoCyprusCzech RepublicDenmarkDominican RepublicEarly-demographic dividendEast Asia & PacificEast Asia & Pacific (excluding high income)East Asia & Pacific (IDA & IBRD countries)EcuadorEgypt, Arab Rep.El SalvadorEritreaEstoniaEthiopiaEuro areaEurope & Central AsiaEurope & Central Asia (excluding high income)Europe & Central Asia (IDA & IBRD countries)European UnionFinlandFragile and conflict affected situationsFranceGabonGeorgiaGermanyGhanaGibraltarGreeceGuatemalaHaitiHeavily indebted poor countries (HIPC)High incomeHondurasHong Kong SAR, ChinaHungaryIBRD onlyIcelandIDA & IBRD totalIDA blendIDA onlyIDA totalIndiaIndonesiaIran, Islamic Rep.IraqIrelandIsraelItalyJamaicaJapanJordanKazakhstanKenyaKorea, Dem. People’s Rep.Korea, Rep.KosovoKuwaitKyrgyz RepublicLate-demographic dividendLatin America & Caribbean Latin America & Caribbean (excluding high income)Latin America & the Caribbean (IDA & IBRD countries)LatviaLeast developed countries: UN classificationLebanonLibyaLithuaniaLow & middle incomeLow incomeLower middle incomeLuxembourgMacedonia, FYRMalaysiaMaltaMauritiusMexicoMiddle East & North AfricaMiddle East & North Africa (excluding high income)Middle East & North Africa (IDA & IBRD countries)Middle incomeMoldovaMongoliaMontenegroMoroccoMozambiqueMyanmarNamibiaNepalNetherlandsNew ZealandNicaraguaNigerNigeriaNorth AmericaNorwayOECD membersOmanOther small statesPakistanPanamaParaguayPeruPhilippinesPolandPortugalPost-demographic dividendPre-demographic dividendQatarRomaniaRussian FederationSaudi ArabiaSenegalSerbiaSingaporeSlovak RepublicSloveniaSmall statesSouth AfricaSouth AsiaSouth Asia (IDA & IBRD)South SudanSpainSri LankaSub-Saharan Africa Sub-Saharan Africa (excluding high income)Sub-Saharan Africa (IDA & IBRD countries)SudanSwedenSwitzerlandSyrian Arab RepublicTajikistanTanzaniaThailandTogoTrinidad and TobagoTunisiaTurkeyTurkmenistanUkraineUnited Arab EmiratesUnited KingdomUnited StatesUpper middle incomeUruguayUzbekistanVenezuela, RBVietnamWorldYemen, Rep.ZambiaZimbabwe Linha do tempo:
Nesta escala de tempo está apresentado um gráfico de 1972 ano até 2014 ano Sri Lanka. Dados de 1971 ano ausente. O número de observações reais por data: 43.
Fonte (nome):
Indicadores de desenvolvimento mundial
Fonte (organização):
IEA Statistics © OECD/IEA 2014 (http://www.iea.org/stats/index.asp), subject to https://www.iea.org/t&c/termsandconditions/
Categorias:
Environment
Foi atualizado:
23 abr 2017 ano
Indicadores de alterações dos valores ao longo dos anos
Mínimo:
4.087
1 jan 1991 ano
Máximo:
40.535
1 jan 2013 ano
Na data de observação
Valor
Mudança absoluta
A alteração em relação ao valor anterior
1 jan 1972 ano
9.058
+9.058
0.0%
1 jan 1973 ano
9.44
+0.382
4.21%
1 jan 1974 ano
13.598
+4.158
44.05%
1 jan 1975 ano
7.958
-5.639
-41.47%
1 jan 1976 ano
7.197
-0.762
-9.57%
1 jan 1977 ano
7.807
+0.61
8.47%
1 jan 1978 ano
6.897
-0.91
-11.66%
1 jan 1979 ano
5.389
-1.507
-21.86%
1 jan 1980 ano
7.459
+2.069
38.4%
1 jan 1981 ano
12.431
+4.972
66.67%
1 jan 1982 ano
12.766
+0.335
2.7%
1 jan 1983 ano
16.351
+3.585
28.08%
1 jan 1984 ano
24.55
+8.199
50.14%
1 jan 1985 ano
8.901
-15.649
-63.74%
1 jan 1986 ano
5.172
-3.728
-41.89%
1 jan 1987 ano
4.665
-0.508
-9.82%
1 jan 1988 ano
16.414
+11.749
251.88%
1 jan 1989 ano
8.488
-7.926
-48.29%
1 jan 1990 ano
4.735
-3.753
-44.21%
1 jan 1991 ano
4.087
-0.648
-13.69%
1 jan 1992 ano
8.639
+4.552
111.36%
1 jan 1993 ano
16.09
+7.451
86.25%
1 jan 1994 ano
8.732
-7.358
-45.73%
1 jan 1995 ano
8.163
-0.569
-6.51%
1 jan 1996 ano
6.606
-1.558
-19.08%
1 jan 1997 ano
15.163
+8.557
129.55%
1 jan 1998 ano
18.868
+3.705
24.43%
1 jan 1999 ano
16.121
-2.747
-14.56%
1 jan 2000 ano
17.143
+1.022
6.34%
1 jan 2001 ano
31.559
+14.416
84.09%
1 jan 2002 ano
29.519
-2.04
-6.46%
1 jan 2003 ano
31.996
+2.477
8.39%
1 jan 2004 ano
33.138
+1.142
3.57%
1 jan 2005 ano
36.149
+3.011
9.09%
1 jan 2006 ano
34.653
-1.497
-4.14%
1 jan 2007 ano
28.862
-5.79
-16.71%
1 jan 2008 ano
31.709
+2.847
9.86%
1 jan 2009 ano
33.251
+1.542
4.86%
1 jan 2010 ano
35.554
+2.303
6.93%
1 jan 2011 ano
27.5
-8.054
-22.65%
1 jan 2012 ano
35.31
+7.81
28.4%
1 jan 2013 ano
40.535
+5.225
14.8%
1 jan 2014 ano
29.694
-10.841
-26.74%
Classificação de países por estatísticas atuais por anos


Comentários: