29
/pt/
pt
AIzaSyAYiBZKx7MnpbEhh9jyipgxe19OcubqV5w
April 1, 2024
69569
Argentina
ARG
true
2
1
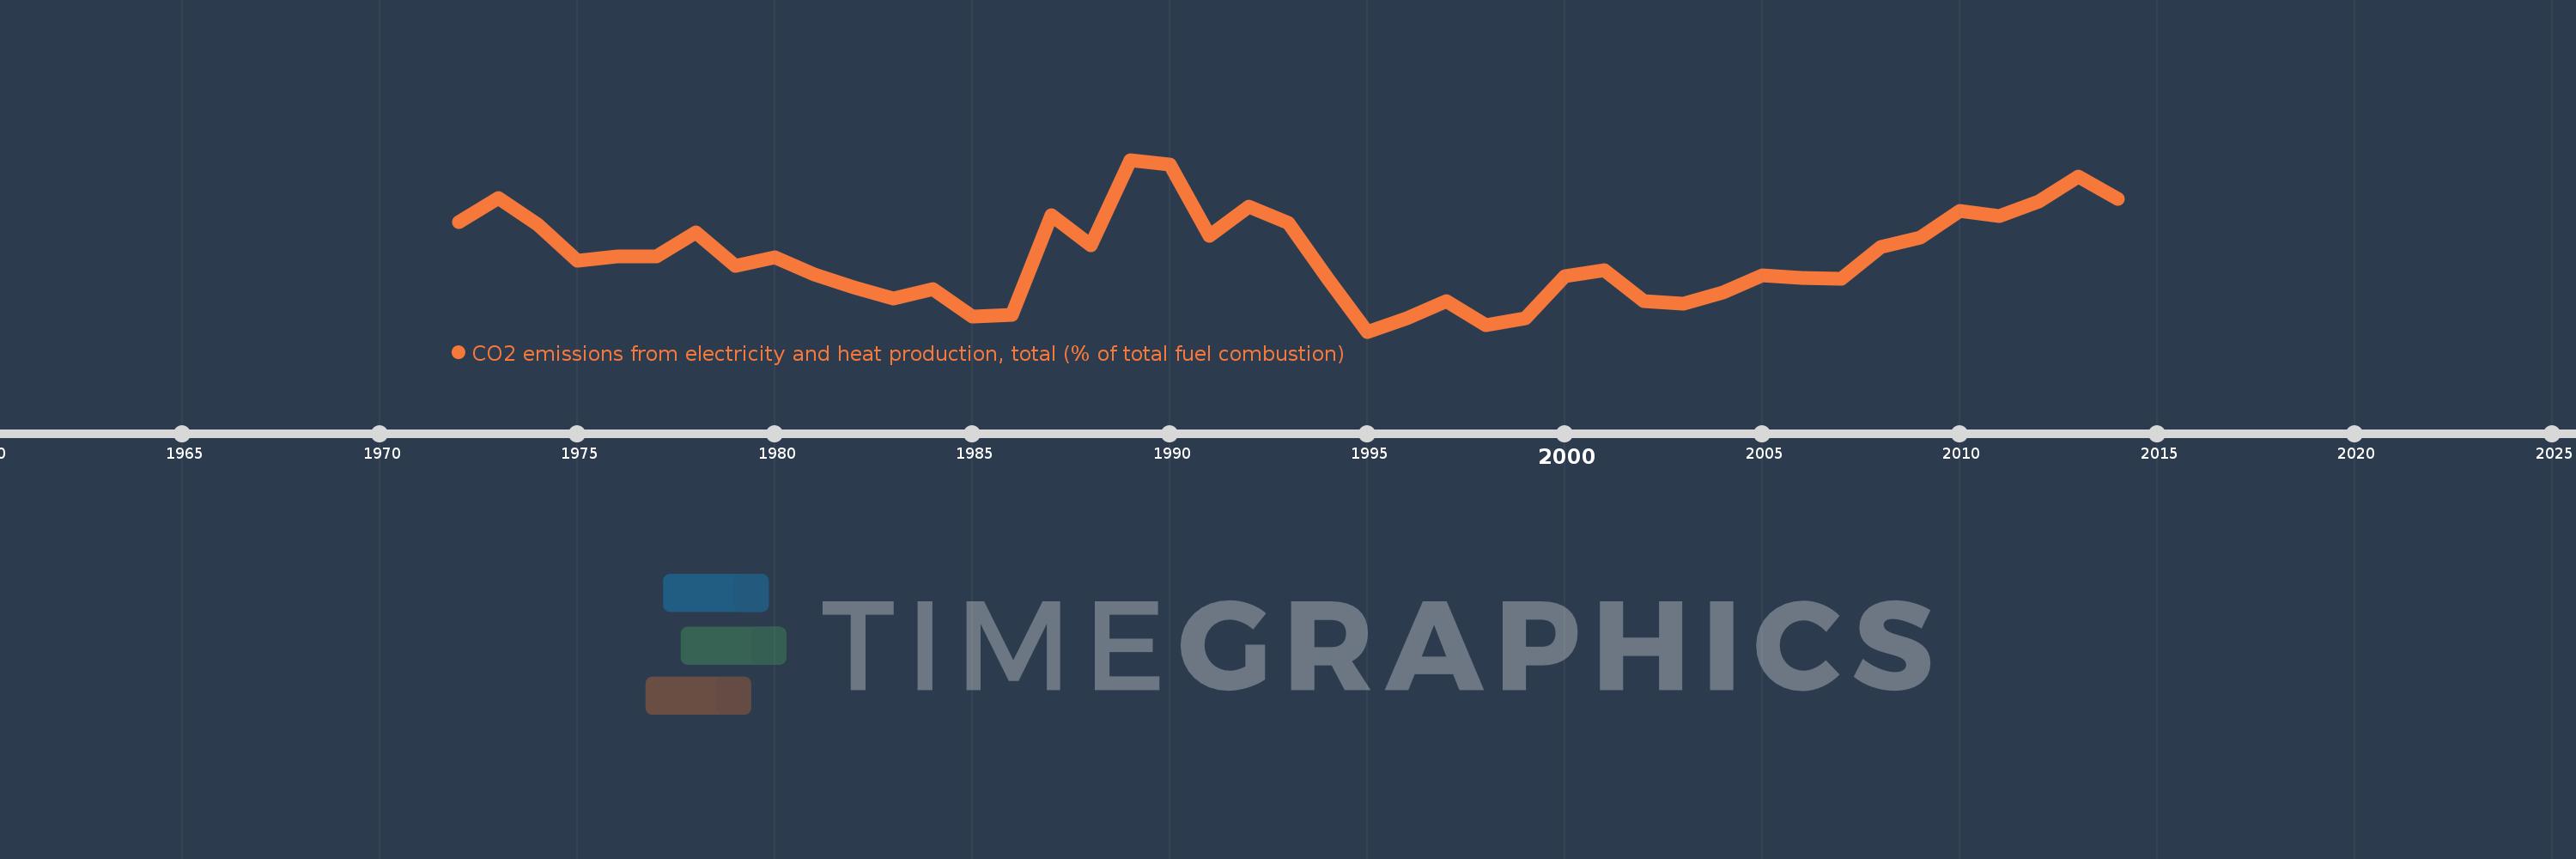
CO2 emissions from electricity and heat production, total (% of total fuel combustion)
2014,2013,2012,2011,2010,2009,2008,2007,2006,2005,2004,2003,2002,2001,2000,1999,1998,1997,1996,1995,1994,1993,1992,1991,1990,1989,1988,1987,1986,1985,1984,1983,1982,1981,1980,1979,1978,1977,1976,1975,1974,1973,1972
Estas estatísticas em outros países:
AlbaniaAlgeriaAngolaArab WorldArgentinaArmeniaAustraliaAustriaAzerbaijanBahrainBangladeshBelarusBelgiumBeninBoliviaBosnia and HerzegovinaBotswanaBrazilBrunei DarussalamBulgariaCambodiaCameroonCanadaCaribbean small statesCentral Europe and the BalticsChileChinaColombiaCongo, Dem. Rep.Congo, Rep.Costa RicaCote d'IvoireCroatiaCubaCuracaoCyprusCzech RepublicDenmarkDominican RepublicEarly-demographic dividendEast Asia & PacificEast Asia & Pacific (excluding high income)East Asia & Pacific (IDA & IBRD countries)EcuadorEgypt, Arab Rep.El SalvadorEritreaEstoniaEthiopiaEuro areaEurope & Central AsiaEurope & Central Asia (excluding high income)Europe & Central Asia (IDA & IBRD countries)European UnionFinlandFragile and conflict affected situationsFranceGabonGeorgiaGermanyGhanaGibraltarGreeceGuatemalaHaitiHeavily indebted poor countries (HIPC)High incomeHondurasHong Kong SAR, ChinaHungaryIBRD onlyIcelandIDA & IBRD totalIDA blendIDA onlyIDA totalIndiaIndonesiaIran, Islamic Rep.IraqIrelandIsraelItalyJamaicaJapanJordanKazakhstanKenyaKorea, Dem. People’s Rep.Korea, Rep.KosovoKuwaitKyrgyz RepublicLate-demographic dividendLatin America & Caribbean Latin America & Caribbean (excluding high income)Latin America & the Caribbean (IDA & IBRD countries)LatviaLeast developed countries: UN classificationLebanonLibyaLithuaniaLow & middle incomeLow incomeLower middle incomeLuxembourgMacedonia, FYRMalaysiaMaltaMauritiusMexicoMiddle East & North AfricaMiddle East & North Africa (excluding high income)Middle East & North Africa (IDA & IBRD countries)Middle incomeMoldovaMongoliaMontenegroMoroccoMozambiqueMyanmarNamibiaNepalNetherlandsNew ZealandNicaraguaNigerNigeriaNorth AmericaNorwayOECD membersOmanOther small statesPakistanPanamaParaguayPeruPhilippinesPolandPortugalPost-demographic dividendPre-demographic dividendQatarRomaniaRussian FederationSaudi ArabiaSenegalSerbiaSingaporeSlovak RepublicSloveniaSmall statesSouth AfricaSouth AsiaSouth Asia (IDA & IBRD)South SudanSpainSri LankaSub-Saharan Africa Sub-Saharan Africa (excluding high income)Sub-Saharan Africa (IDA & IBRD countries)SudanSwedenSwitzerlandSyrian Arab RepublicTajikistanTanzaniaThailandTogoTrinidad and TobagoTunisiaTurkeyTurkmenistanUkraineUnited Arab EmiratesUnited KingdomUnited StatesUpper middle incomeUruguayUzbekistanVenezuela, RBVietnamWorldYemen, Rep.ZambiaZimbabwe Linha do tempo:
Nesta escala de tempo está apresentado um gráfico de 1972 ano até 2014 ano Argentina. Dados de 1971 ano ausente. O número de observações reais por data: 43.
Fonte (nome):
Indicadores de desenvolvimento mundial
Fonte (organização):
IEA Statistics © OECD/IEA 2014 (http://www.iea.org/stats/index.asp), subject to https://www.iea.org/t&c/termsandconditions/
Categorias:
Environment
Foi atualizado:
23 abr 2017 ano
Indicadores de alterações dos valores ao longo dos anos
Mínimo:
28.266
1 jan 1995 ano
Máximo:
39.538
1 jan 1989 ano
Na data de observação
Valor
Mudança absoluta
A alteração em relação ao valor anterior
1 jan 1972 ano
35.471
+35.471
0.0%
1 jan 1973 ano
37.048
+1.577
4.45%
1 jan 1974 ano
35.273
-1.776
-4.79%
1 jan 1975 ano
32.925
-2.348
-6.66%
1 jan 1976 ano
33.181
+0.256
0.78%
1 jan 1977 ano
33.192
+0.011
0.03%
1 jan 1978 ano
34.796
+1.604
4.83%
1 jan 1979 ano
32.603
-2.192
-6.3%
1 jan 1980 ano
33.135
+0.531
1.63%
1 jan 1981 ano
32.019
-1.116
-3.37%
1 jan 1982 ano
31.163
-0.855
-2.67%
1 jan 1983 ano
30.411
-0.752
-2.41%
1 jan 1984 ano
31.061
+0.65
2.14%
1 jan 1985 ano
29.256
-1.805
-5.81%
1 jan 1986 ano
29.342
+0.086
0.29%
1 jan 1987 ano
35.88
+6.538
22.28%
1 jan 1988 ano
33.91
-1.97
-5.49%
1 jan 1989 ano
39.538
+5.628
16.6%
1 jan 1990 ano
39.226
-0.312
-0.79%
1 jan 1991 ano
34.527
-4.699
-11.98%
1 jan 1992 ano
36.486
+1.959
5.67%
1 jan 1993 ano
35.388
-1.098
-3.01%
1 jan 1994 ano
31.74
-3.648
-10.31%
1 jan 1995 ano
28.266
-3.475
-10.95%
1 jan 1996 ano
29.154
+0.888
3.14%
1 jan 1997 ano
30.255
+1.101
3.78%
1 jan 1998 ano
28.668
-1.587
-5.25%
1 jan 1999 ano
29.155
+0.487
1.7%
1 jan 2000 ano
31.886
+2.731
9.37%
1 jan 2001 ano
32.309
+0.424
1.33%
1 jan 2002 ano
30.272
-2.037
-6.3%
1 jan 2003 ano
30.094
-0.179
-0.59%
1 jan 2004 ano
30.839
+0.745
2.48%
1 jan 2005 ano
31.943
+1.105
3.58%
1 jan 2006 ano
31.785
-0.158
-0.5%
1 jan 2007 ano
31.704
-0.082
-0.26%
1 jan 2008 ano
33.817
+2.113
6.66%
1 jan 2009 ano
34.45
+0.634
1.87%
1 jan 2010 ano
36.197
+1.747
5.07%
1 jan 2011 ano
35.823
-0.375
-1.04%
1 jan 2012 ano
36.813
+0.99
2.76%
1 jan 2013 ano
38.413
+1.6
4.35%
1 jan 2014 ano
36.982
-1.431
-3.73%
Classificação de países por estatísticas atuais por anos


Comentários: