29
/fr/
fr
AIzaSyAYiBZKx7MnpbEhh9jyipgxe19OcubqV5w
April 1, 2024
89785
Botswana
BWA
true
2
1
Foreign direct investment, net inflows (BoP, current US$)
2016,2015,2014,2013,2012,2011,2010,2009,2008,2007,2006,2005,2004,2003,2002,2001,2000,1999,1998,1997,1996,1995,1994,1993,1992,1991,1990,1989,1988,1987,1986,1985,1984,1983,1982,1981,1980,1979,1978,1977,1976
Cette statistique dans les autres pays:
AfghanistanAlbaniaAlgeriaAngolaAntigua and BarbudaArab WorldArgentinaArmeniaArubaAustraliaAustriaAzerbaijanBahamas, TheBahrainBangladeshBarbadosBelarusBelgiumBelizeBeninBermudaBhutanBoliviaBosnia and HerzegovinaBotswanaBrazilBritish Virgin IslandsBrunei DarussalamBulgariaBurkina FasoBurundiCabo VerdeCambodiaCameroonCanadaCaribbean small statesCayman IslandsCentral African RepublicCentral Europe and the BalticsChadChileChinaColombiaComorosCongo, Dem. Rep.Congo, Rep.Costa RicaCote d'IvoireCroatiaCuracaoCyprusCzech RepublicDenmarkDjiboutiDominicaDominican RepublicEarly-demographic dividendEast Asia & PacificEast Asia & Pacific (excluding high income)East Asia & Pacific (IDA & IBRD countries)EcuadorEgypt, Arab Rep.El SalvadorEquatorial GuineaEritreaEstoniaEthiopiaEuro areaEurope & Central AsiaEurope & Central Asia (excluding high income)Europe & Central Asia (IDA & IBRD countries)European UnionFijiFinlandFragile and conflict affected situationsFranceFrench PolynesiaGabonGambia, TheGeorgiaGermanyGhanaGibraltarGreeceGrenadaGuatemalaGuineaGuinea-BissauGuyanaHaitiHeavily indebted poor countries (HIPC)High incomeHondurasHong Kong SAR, ChinaHungaryIBRD onlyIcelandIDA & IBRD totalIDA blendIDA onlyIDA totalIndiaIndonesiaIran, Islamic Rep.IraqIrelandIsraelItalyJamaicaJapanJordanKazakhstanKenyaKiribatiKorea, Dem. People’s Rep.Korea, Rep.KosovoKuwaitKyrgyz RepublicLao PDRLate-demographic dividendLatin America & Caribbean Latin America & Caribbean (excluding high income)Latin America & the Caribbean (IDA & IBRD countries)LatviaLeast developed countries: UN classificationLebanonLesothoLiberiaLibyaLithuaniaLow & middle incomeLow incomeLower middle incomeLuxembourgMacao SAR, ChinaMacedonia, FYRMadagascarMalawiMalaysiaMaldivesMaliMaltaMarshall IslandsMauritaniaMauritiusMexicoMicronesia, Fed. Sts.Middle East & North AfricaMiddle East & North Africa (excluding high income)Middle East & North Africa (IDA & IBRD countries)Middle incomeMoldovaMongoliaMontenegroMoroccoMozambiqueMyanmarNamibiaNauruNepalNetherlandsNew CaledoniaNew ZealandNicaraguaNigerNigeriaNorth AmericaNorthern Mariana IslandsNorwayOECD membersOmanOther small statesPacific island small statesPakistanPalauPanamaPapua New GuineaParaguayPeruPhilippinesPolandPortugalPost-demographic dividendPre-demographic dividendQatarRomaniaRussian FederationRwandaSamoaSao Tome and PrincipeSaudi ArabiaSenegalSerbiaSeychellesSierra LeoneSingaporeSint Maarten (Dutch part)Slovak RepublicSloveniaSmall statesSolomon IslandsSomaliaSouth AfricaSouth AsiaSouth Asia (IDA & IBRD)South SudanSpainSri LankaSt. Kitts and NevisSt. LuciaSt. Vincent and the GrenadinesSub-Saharan Africa Sub-Saharan Africa (excluding high income)Sub-Saharan Africa (IDA & IBRD countries)SudanSurinameSwazilandSwedenSwitzerlandSyrian Arab RepublicTajikistanTanzaniaThailandTimor-LesteTogoTongaTrinidad and TobagoTunisiaTurkeyTurkmenistanTuvaluUgandaUkraineUnited Arab EmiratesUnited KingdomUnited StatesUpper middle incomeUruguayUzbekistanVanuatuVenezuela, RBVietnamWest Bank and GazaWorldYemen, Rep.ZambiaZimbabwe La ligne de temps
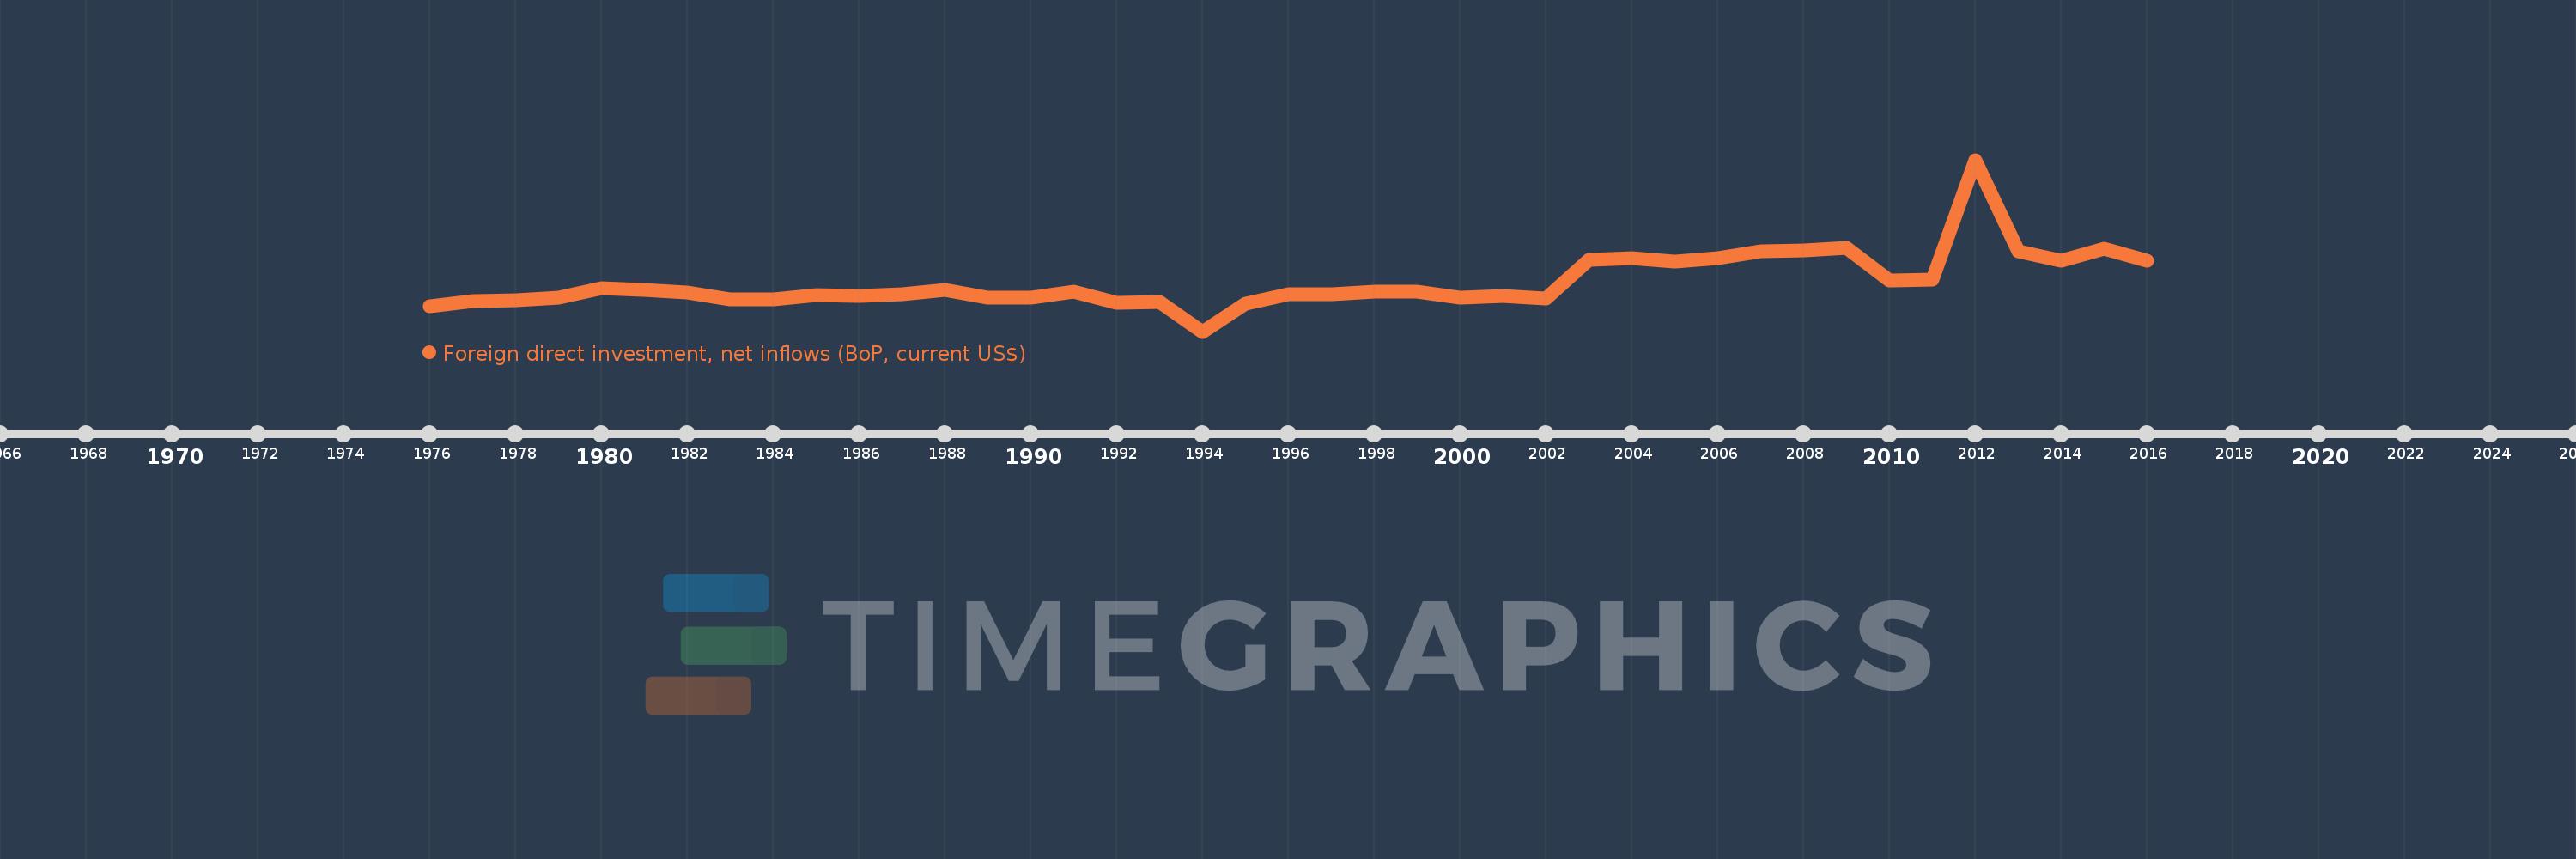
Cette échelle de temps montre un graphique de 1976 année à 2016 année Botswana. Les données jusqu'à 1975 année ne sont pas présentés. Quantité d'observations actuelles selon dates: 41.
Source (désignation):
Les indicateurs du développement mondiale
Source (organisation):
International Monetary Fund, Balance of Payments database, supplemented by data from the United Nations Conference on Trade and Development and official national sources.
Catégories:
Economy & Growth, Financial Sector, External Debt
Dernière mise à jour
23 avr. 2017
Les indicateurs de changement de valeurs selon les années
Minimum:
-286.949 mln.
1 janv. 1994
Maximum:
1.371 mds
1 janv. 2012
Pour la date d''observation
Valeur
Changement absolu
Le changement par rapport à la valeur précédente
1 janv. 1976
-38.269 mln.
-38.269 mln.
0.0%
1 janv. 1977
11.27 mln.
+49.539 mln.
-129.45%
1 janv. 1978
12.233 mln.
+963.362 milles
8.55%
1 janv. 1979
40.814 mln.
+28.58 mln.
233.62%
1 janv. 1980
127.852 mln.
+87.038 mln.
213.26%
1 janv. 1981
111.551 mln.
-16.301 mln.
-12.75%
1 janv. 1982
88.439 mln.
-23.112 mln.
-20.72%
1 janv. 1983
21.075 mln.
-67.364 mln.
-76.17%
1 janv. 1984
23.794 mln.
+2.719 mln.
12.9%
1 janv. 1985
62.155 mln.
+38.361 mln.
161.22%
1 janv. 1986
53.612 mln.
-8.543 mln.
-13.74%
1 janv. 1987
70.404 mln.
+16.793 mln.
31.32%
1 janv. 1988
113.584 mln.
+43.179 mln.
61.33%
1 janv. 1989
39.922 mln.
-73.662 mln.
-64.85%
1 janv. 1990
42.186 mln.
+2.264 mln.
5.67%
1 janv. 1991
95.89 mln.
+53.704 mln.
127.3%
1 janv. 1992
-8.211 mln.
-104.101 mln.
-108.56%
1 janv. 1993
-1.564 mln.
+6.647 mln.
-80.95%
1 janv. 1994
-286.949 mln.
-285.385 mln.
18.24 milles%
1 janv. 1995
-14.155 mln.
+272.795 mln.
-95.07%
1 janv. 1996
70.413 mln.
+84.568 mln.
-597.46%
1 janv. 1997
71.182 mln.
+769.09 milles
1.09%
1 janv. 1998
100.11 mln.
+28.927 mln.
40.64%
1 janv. 1999
95.318 mln.
-4.792 mln.
-4.79%
1 janv. 2000
36.675 mln.
-58.643 mln.
-61.52%
1 janv. 2001
57.176 mln.
+20.501 mln.
55.9%
1 janv. 2002
30.682 mln.
-26.494 mln.
-46.34%
1 janv. 2003
403.414 mln.
+372.732 mln.
1.21 milles%
1 janv. 2004
417.986 mln.
+14.572 mln.
3.61%
1 janv. 2005
391.067 mln.
-26.919 mln.
-6.44%
1 janv. 2006
421.381 mln.
+30.314 mln.
7.75%
1 janv. 2007
486.39 mln.
+65.009 mln.
15.43%
1 janv. 2008
494.682 mln.
+8.292 mln.
1.7%
1 janv. 2009
520.918 mln.
+26.236 mln.
5.3%
1 janv. 2010
208.699 mln.
-312.219 mln.
-59.94%
1 janv. 2011
218.38 mln.
+9.681 mln.
4.64%
1 janv. 2012
1.371 mds
+1.153 mds
527.84%
1 janv. 2013
487.171 mln.
-883.916 mln.
-64.47%
1 janv. 2014
398.457 mln.
-88.714 mln.
-18.21%
1 janv. 2015
515.184 mln.
+116.727 mln.
29.29%
1 janv. 2016
393.575 mln.
-121.61 mln.
-23.61%
Classement des pays selon les statistiques actuelles par années


Commentaires: